INTRODUCTION
Odoo Purchase Dashboard to manage and analyze purchases!!
Keeping track of purchases is not easy, even with inventory management. Moreover, you can’t track purchase volume and what product you require more often and which not.
To make it easier, you require a solution that can measure your purchase volume and also convert it into more understandable charts and graphs. Additionally, it should make it easier to assess the data.
Odoo Purchase Dashboard allows you to assess data and present it with charts and graphs. Further, you can easily compare and see volumes and evaluate which product you need more often. Also, the module offers several types of charts and graphs for you to view stats in a preferred way.
FEATURES
- The module helps you manage purchase orders in Odoo.
- You can easily manage your supplier.
- Correctly check the status of incoming products/shipments.
- Also, the admin can see the count of purchase orders state-wise for all users from the dashboard.
- Include Analytical Data of your business in Odoo under one screen.
- Use Plots and Graphs to study the store data.
- Moreover, it auto- fetches the required data and plots it on the graph.
- Analyze and Strategize the data to implement proper growth steps.
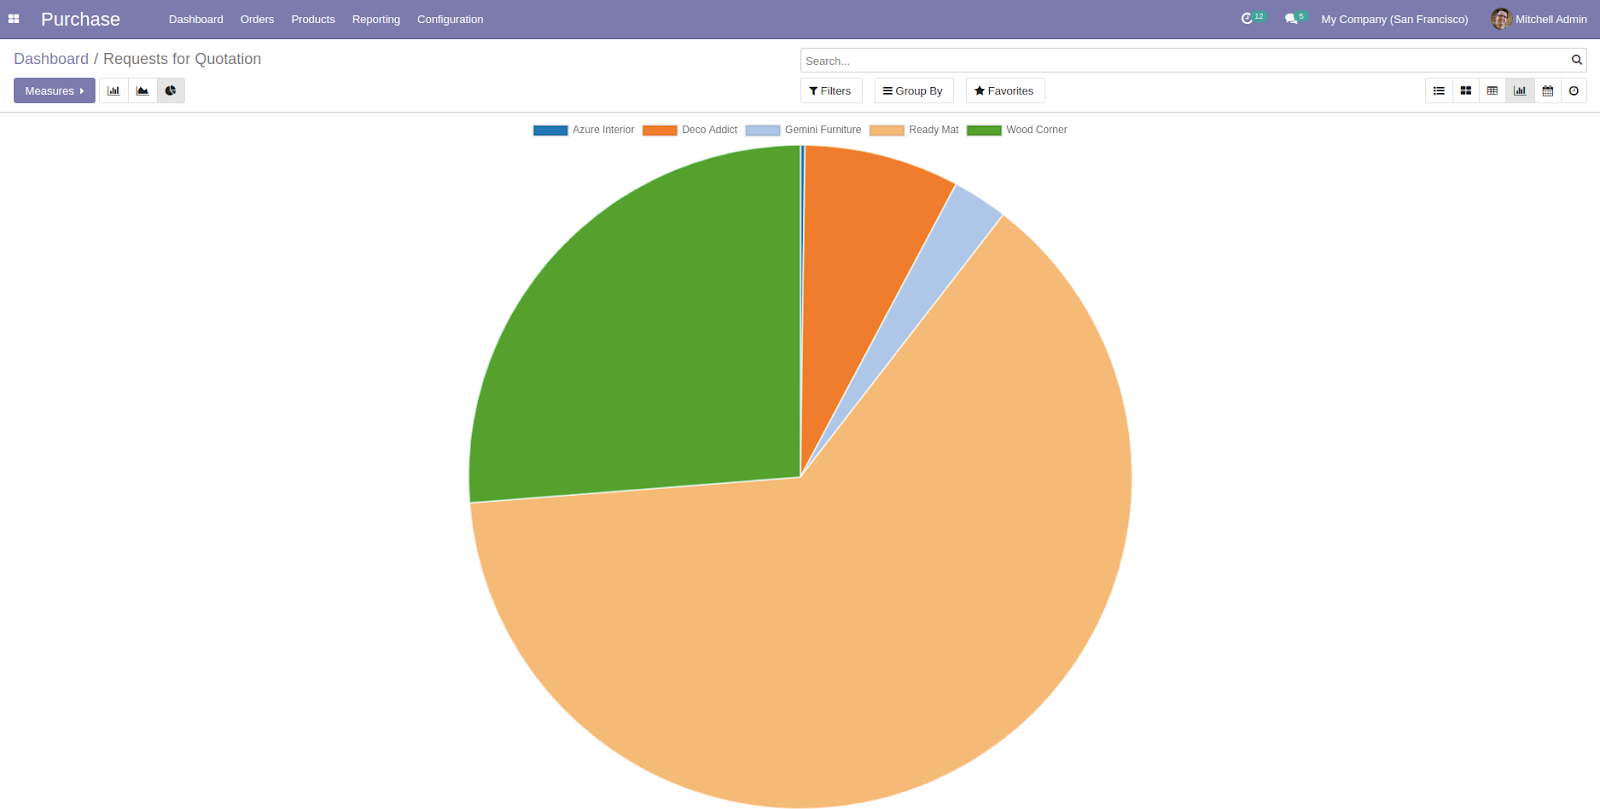
- Further, choose from several different graphs and charts such as Pie charts, Line charts, Doughnut Charts, Histograms (Vertical and Horizontal), etc.
- It also includes tiles and cards for Quick View.
- Use the Predefined options to create any desired plot/graph in seconds.
- Can create a custom graph using the Create Graph Menu.
- In addition, you can create new graphs from scratch.
- Choose the data to fill, limit the number of records, etc.
- Quickly edit and arrange the graphs directly from the Odoo Purchase Dashboard.
- Set the number of records that you can use in the graphs and charts while plotting.
- Further, the module fetches the data automatically according to the refresh interval setting.
- Choose the Data Refresh Interval to reflect new data on graphs as required.
- Also, set Refresh Rate between one minute to fifteen minutes.
- Configure the Dashboard Color Theme to represent information.
- Use the color palette to distinguish different graph data.
- Further, create and save multiple color themes for different Dashboards.
- Fa-fa icon support for data cards and graphs.
- Moreover, set different Access levels of the Odoo dashboard for users.
- Choose between User and Manager Access.
- Managers have complete edit rights of Odoo Dashboard.
- On the contrary, users can only view and have limited edit rights.
- Use Custom filters to sort out and study the Odoo Dashboard.
- Provided- time and date filters to improve visibility.
- Also, put together for people who manage multiple companies in the same Odoo.
- Use a separate Odoo Dashboard For different companies in Odoo.
- Additionally, handle and study the Dashboard data for each individually.
- Compare the information instantly from various of your companies in Odoo.
- Above all, the module is mobile responsive.
INSTALLATION
- Once you purchase the App from Webkul store, you will receive the link to download the zip file of the module.
- Extract the file on your system after the download finishes. You will be able to see a folder named- ‘wk_purchase_order_dashboard.’
- Copy and paste this folder inside your Odoo Add-Ons path.
- Now, open the Odoo App and click on the Settings menu. Here, click on Activate the Developer Mode.
- Then, open the Apps menu and click on ‘Update Modules List.’
- In the search bar, remove all the filters and search ‘wk_purchase_order_dashboard.’
- You will be able to see the module in the search result. Click on ‘Install’ to install it.
WORKFLOW CONFIGURATION
1. Firstly, open the Odoo backend and go to ‘Settings> Purchase.’ On the page, set the settings as per your requirement.

2. After that, open the Purchase dashboard to view every users ‘Purchase Orders’ and ‘RFQ’ (Request For Quotation). Click on any user to view their details and charts.

3. On the user purchase dashboard, you can view all the purchase orders and RFQs. Click on the top-right to choose from different views like date-wise, graphs, etc.
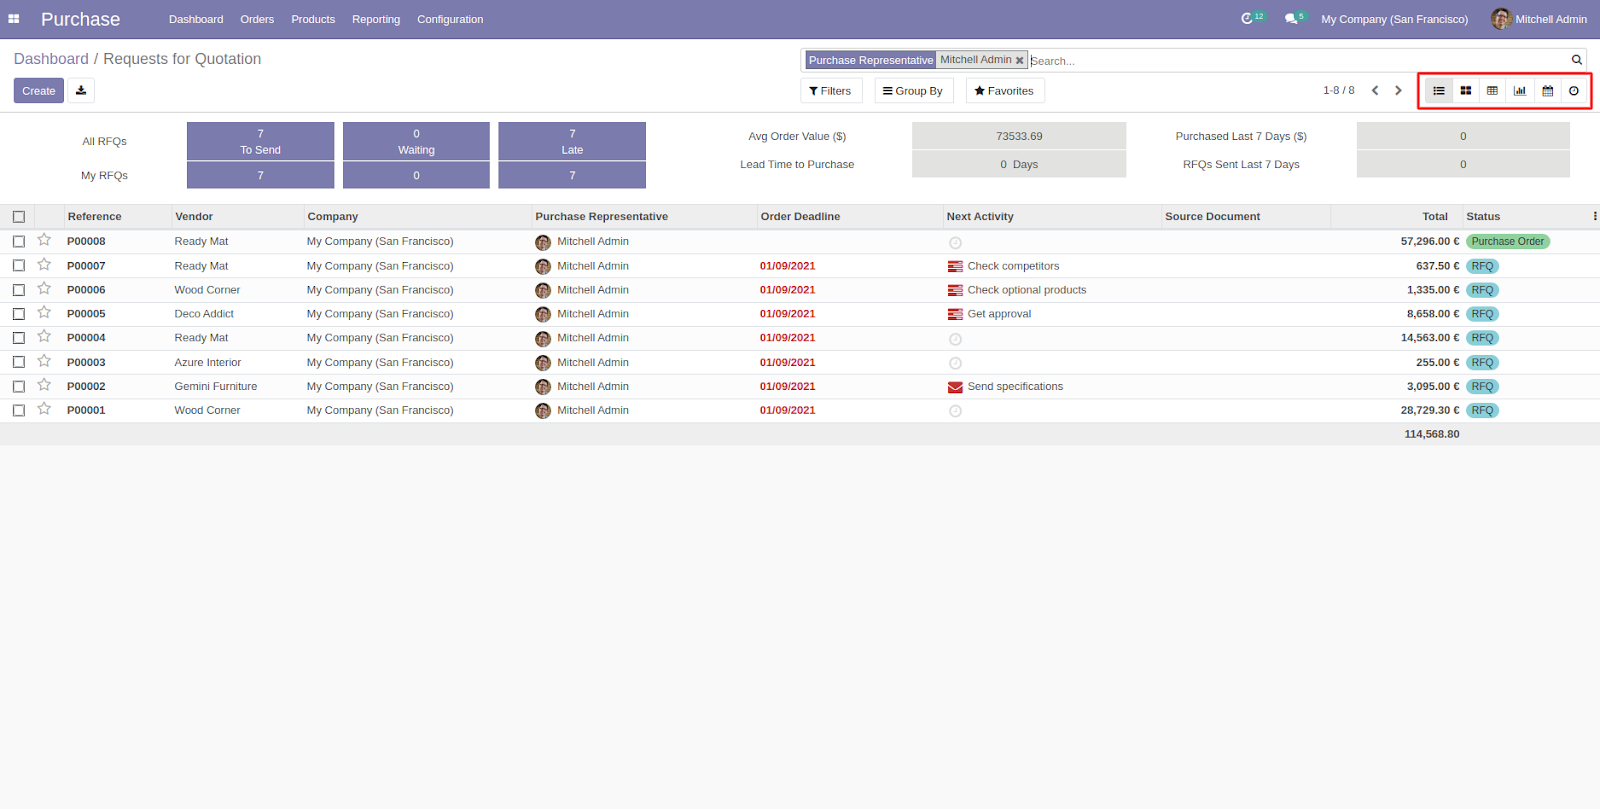
4. On clicking the ‘clock’ icon, you can view the data according to the time.

5. When you click the chart icon in the top-right corner, you can view the types of charts available for data presentation. By default, it will show you a bar graph. However, you can choose from present options such as line charts, pie charts, etc.


OTHER MODULES
- Odoo Delivery Dashboard
- Odoo POS Dashboard
- All-In-One Dynamic Dashboard
- Odoo LeaderBoard
- Odoo Notice Board
NEED HELP?
Hope you find the guide helpful! Please feel free to share your feedback in the comments below.
If you still have any issues/queries regarding the module, please raise a ticket at https://webkul.uvdesk.com/en/customer/create-ticket/.
Also, please explore our Odoo development services & an extensive range of quality Odoo Apps.
For any doubt, contact us at [email protected].
Thanks for paying attention!!
Current Product Version - 1.0.0
Supported Framework Version - V15, V14, V13, V12

Be the first to comment.