Opencart marketplace report system allows sellers and admin to see their reports for sales, products, income, and transactions graphically in Marketplace.
Admin and sellers can see the report for sales, product, income, and transactions. The Admin can see the reports for any particular sellers. Also, reports can be seen in four types of chart pie chart, donut chart, bar chart, and bilevel chart.
This module is an add-on of Opencart Marketplace. You need to install the Opencart Marketplace Module first to install and use this module.
Note:
1. This module supports all templates and themes including the Journal theme.
2. Opencart Marketplace Report module supports the Multi-Store feature of default Opencart.
Check a brief overview of the plugin –
Features Of Opencart Marketplace Report
- Admin/Sellers can view reports for sales.
- The Admin/Sellers can view reports for income.
- Admin/Sellers can view reports for the product.
- The Admin/Sellers can view reports for the transaction.
- Sales reports can be generated on the basis of orders, revenue, and no. of quantity.
- Product reports can be generated on the basis of quantity and revenue.
- Income reports can be generated on the basis of the total amount, remaining amount, paid amount, seller amount, and admin amount.
- The transaction report can be generated on the basis of the transaction amount.
- Admin can view the report of the complete Marketplace.
- The Admin can view the report for a particular seller.
- Admin/sellers can see four types or chart view.
- The Admin/sellers have many options to filter the report.
Installation Of Opencart Marketplace Report
The installation of the Opencart Marketplace Report system is super easy. Under the zip file, you will find three folders, Opencart 2.0.x.x to 2.1.x.x, Opencart 2.2.x.x and Opencart 2.3.x.x .
You need to select the folder according to your Opencart version. Under each version, there are three folders with the name admin, Catalog, and ocmod. You need to upload the admin and catalog folders to the root directory of the website.
 Once you have uploaded the file then login to admin and from the catalog section go to Extensions> Extension installer and upload the XML file. The XML file can be found on the ocmod folder.

After uploading the XML file go to the Extensions > Modification and click on refresh field.
Also, after that in Admin panel go to System -> Users -> Usergroup and edit ‘Administrator’ and select all for both Access and Modify Permission then save it.
After that under Extension > Module, install the Marketplace reporting system Module like this way.
Module Translation
As this Opencart Marketplace Report System module supports multiple languages so this section will describe how to make the module work in different languages. Please check this link for language translation
Configuration Of Marketplace Report System
After installation, the admin can edit the module to enable it. Admin can select the chart types which will be available on the report page.

Also, After configuring the module, go to Extension>Module> Marketplace and click on edit.
After that allow the ‘Reports‘ in the account menu from the Marketplace module so that option can get visible on the account page of sellers.
How seller can check their report
Also, after the installation of the module, a seller can see the ‘Reports’ option in the account section.
Under the ‘Reports’ tab, the seller will receive the menu to check the report for the different sections. A seller can see reports for sales, product, income, and transaction. Also, the seller can see all the chart types which are allowed by admin.
On the report, the page seller has many options to filter the report. Like seller can select the report type, time interval, product, time group, and order status.
Report Type filter: Using this filter seller can refine the report according to product quantity, revenue, and the number of orders.
Start and End date: Seller can select the dates between which they want to see the report.
Products: The Sellers can select the product for which they want to see the report.
Group By: Sellers can select the time period group according to which the report will be visible.
Order Status: The Sellers have the option to filter the report according to the status of the orders.
A seller can see the report in different chart views. In the below image you can see the ‘Bilevel Chart‘ for the sale.
Also, Sellers can see their sales report in the pie chart view like this.
The Sellers can see their sales report in the bar chart view like this.
Product Report for Seller
Sellers can see the report for their products. To open the report for product sellers need to navigate to Reports-> Products under the seller account menu.
A seller can see three types of charts for products Donut, Pie, and Bar Chart. Also, Sellers have many options to filter the report according to their choice.
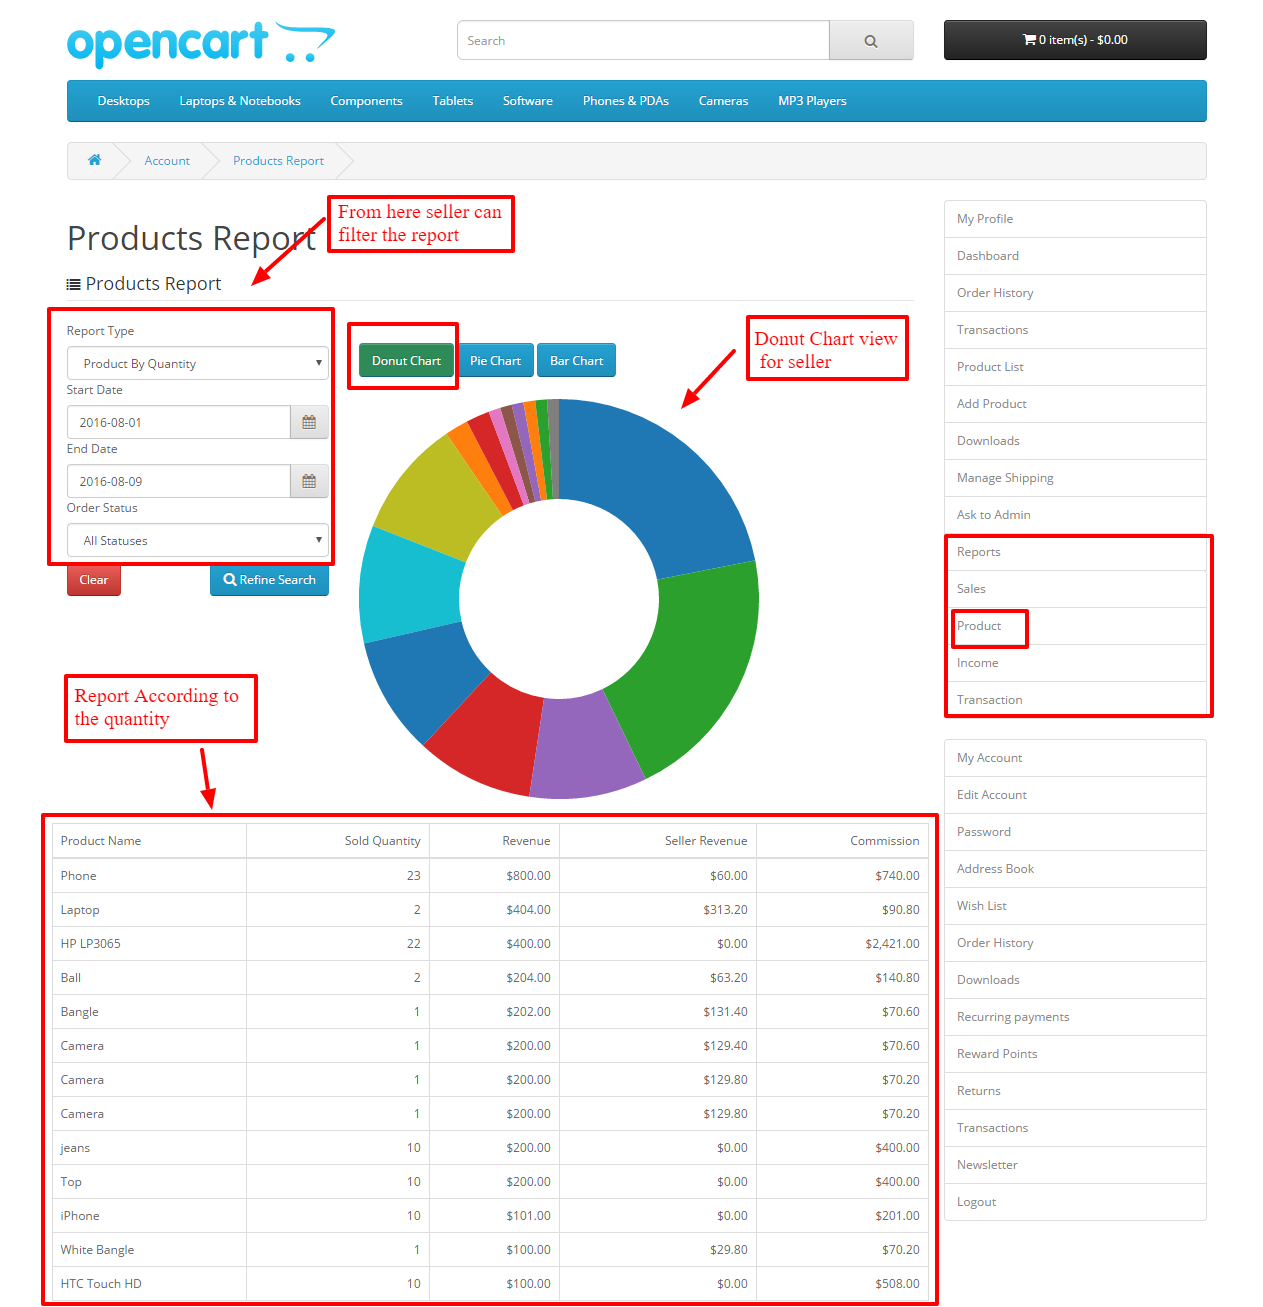
Below you can see the donut chart for the product according to quantity.
The Sellers have the following options to filter the product report:
Report Type: Using this filter type seller can filter the result according to quantity and revenue.
Start and End Date: Here sellers can select the date between which they want to see the report.
Order Status: Sellers can filter the product report according to the order status of the product.
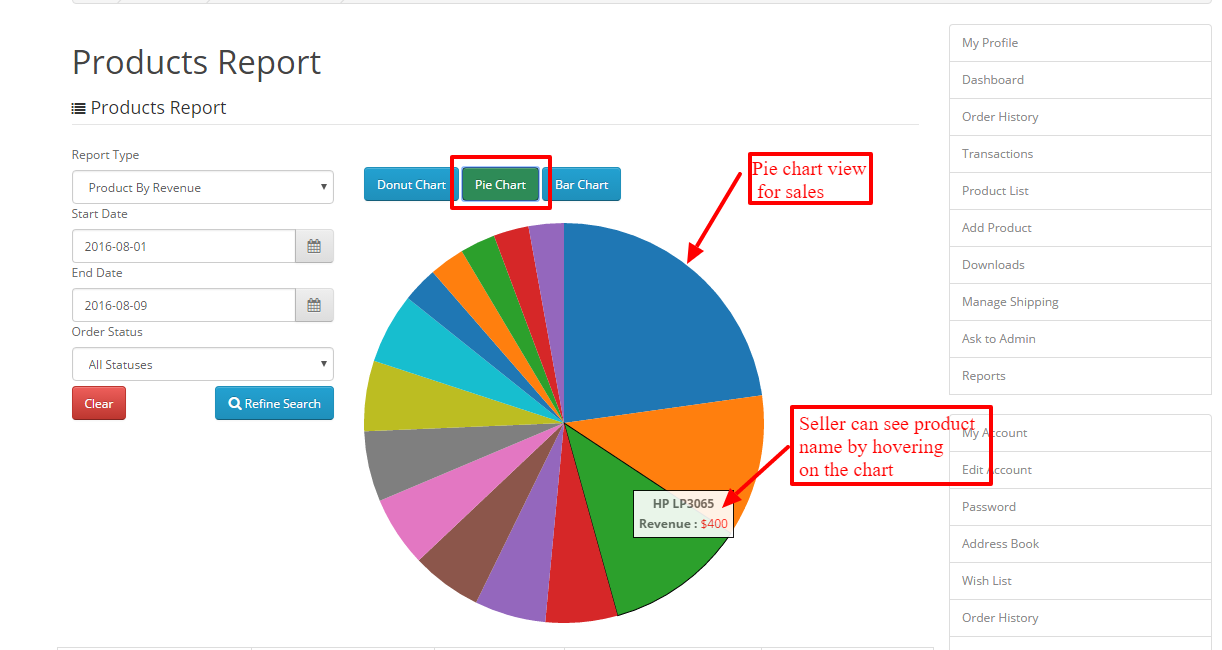
Also, Sellers can see their product report in a pie chart view like this.
The Sellers can see their product report in a bar chart view like this.
Income Report for Seller
Sellers can see the report for their income. To open the report for income seller need to navigate to Reports-> Income under the seller account menu. A seller can see three types of charts for products Donut, Pie, and Bar Chart. Also, Sellers have many options to filter the report according to their choice. Below you can see the donut chart for the product according to quantity.
Also, Sellers have the following options to filter the income report:
Report Type: Using this filter type seller can filter the result according to the amount, remaining amount, paid amount, seller amount, and admin amount.
Seller Amount: Here, the seller can select the price range of the seller amount for which they want to see the report.
Admin Amount: Using this seller can select the price range of the admin amount for which they want to see the report.
Date Added: Also, Seller can select the time range to see the report under which income was added.
Group By: Sellers can select the time period group according to which the report will be visible.
Also, Sellers can see their income report in a pie chart view like this.
The Sellers can see their income report in a bar chart view like this.
Transaction Report for Seller
Sellers can see the report for their transactions. To open the report for transaction seller needs to navigate to Reports-> transaction under the seller account menu. A seller can see three types of charts for transaction Donut, Pie, and Bar Chart. Also, Sellers have many options to filter the report according to their choice. Below you can see the donut chart for transactions according to quantity.
Sellers have the following options to filter the transaction report:
Transaction Amount: Also, Sellers can enter the amount for which they want to see the transaction report.
Comment: Sellers can enter the comment for which they want to see the transaction report.
Date Added: Also, Seller can select the date for which they want to see the transaction report.
The Sellers can see their income report in a pie chart view like this.
Also, the sellers can see their transaction report in a bar chart view like this.
Marketplace Report System for Admin
As like sellers admin can see the report for the complete marketplace from the admin end. To check the report navigate to Marketplace->Reporting from the admin section. From there you can check the reports for sales, products, income, and transaction like seller admin can also see four types of charts for sales report and has many options to filter the report.
Admin has the following options to filter the sales report:
Report Type filter: Using this filter admin can refine the report according to product quantity, revenue, and the number of orders.
Start and End date: Admin can select the dates between which they want to see the report.
Products: Also, Admin can select the product for which they want to see the report.
Group By: Admin can select the time period group according to which the report will be visible.
Order Status: Also, the Admin has the option to filter the report according to the status of the orders.
Sellers: Admin can select a seller for which he/she wants to see the report.
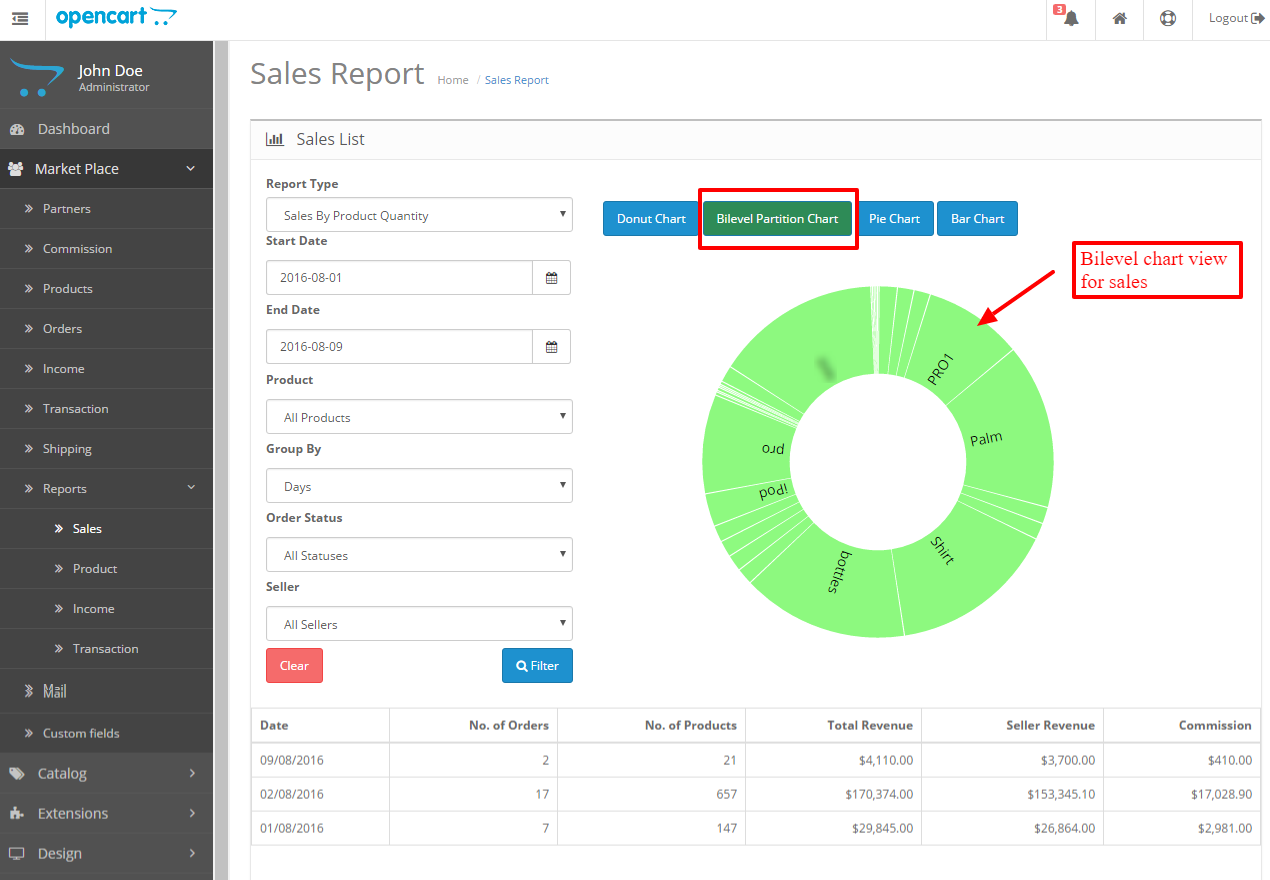
Also, the Admin can see the bilevel chart for sales reports like this.
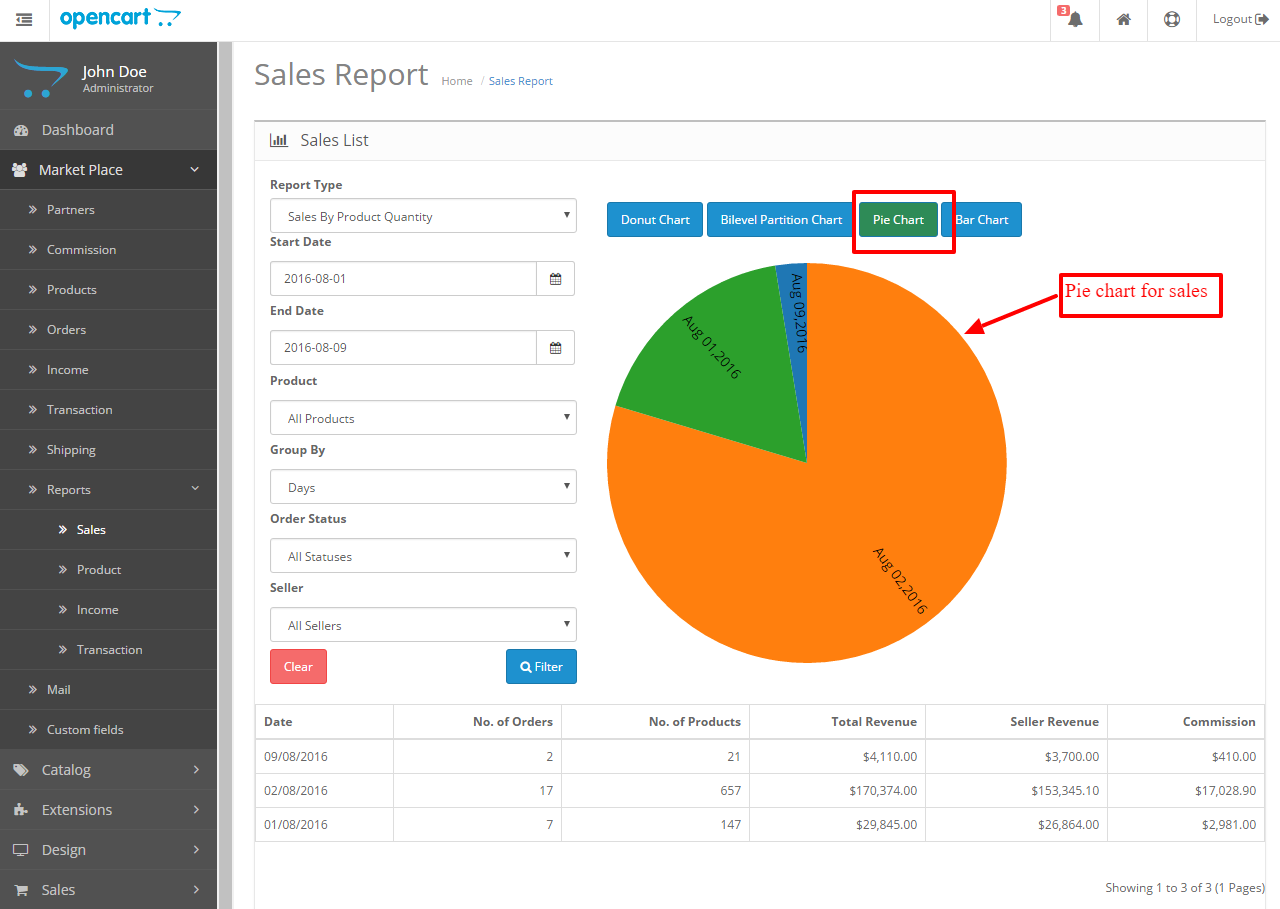
The Admin can see the pie chart for sales reports like this.
Also, Admin can see the bar chart for income sales like this.
Product report for admin
Admin can see the product report by navigating to Marketplace->Reporting->Product from the admin section. The Admin can see 3 types of charts namely donut, pie and bar. Also, the Admin has many options to filter the product report. Admin can see the donut chart for sale like this:
The Admin has the following options to filter the product report:
Report Type: Using this filter type admin can filter the result according to quantity and revenue.
Start and End Date: Here admin can select the date between which they want to see the report.
Order Status: Also, the admin can filter the product report according to the order status of the product.
Sellers: Admin can select a seller for which he/she want to see the report.
The Admin can see the pie chart for a product report like this.
Also, Admin can see the bar chart view for product reports like this.
Income Report For Admin
Admin can see the income report by navigating to Marketplace->Reporting->Income from the admin section. The Admin can see 3 types of charts namely donut, pie and bar. Here, Admin also has many options to filter the income report. Also, Admin can see the donut chart for sale like this:
Admin has the following options to filter the income report:
Report Type: Using this filter type admin can filter the result according to the amount, remaining amount, paid amount, seller amount, and admin amount.
Seller Name: Admin can enter a particular seller name to see the income report.
The Seller Amount: Using this admin can select the price range of the seller amount for which they want to see the report.
Admin Amount: Here admin can select the price range of admin amount for which they want to see the report.
Date Added: Admin can select the time range to see the report under which income was added.
Group By: Also, Admin can select the time period group according to which the report will be visible.
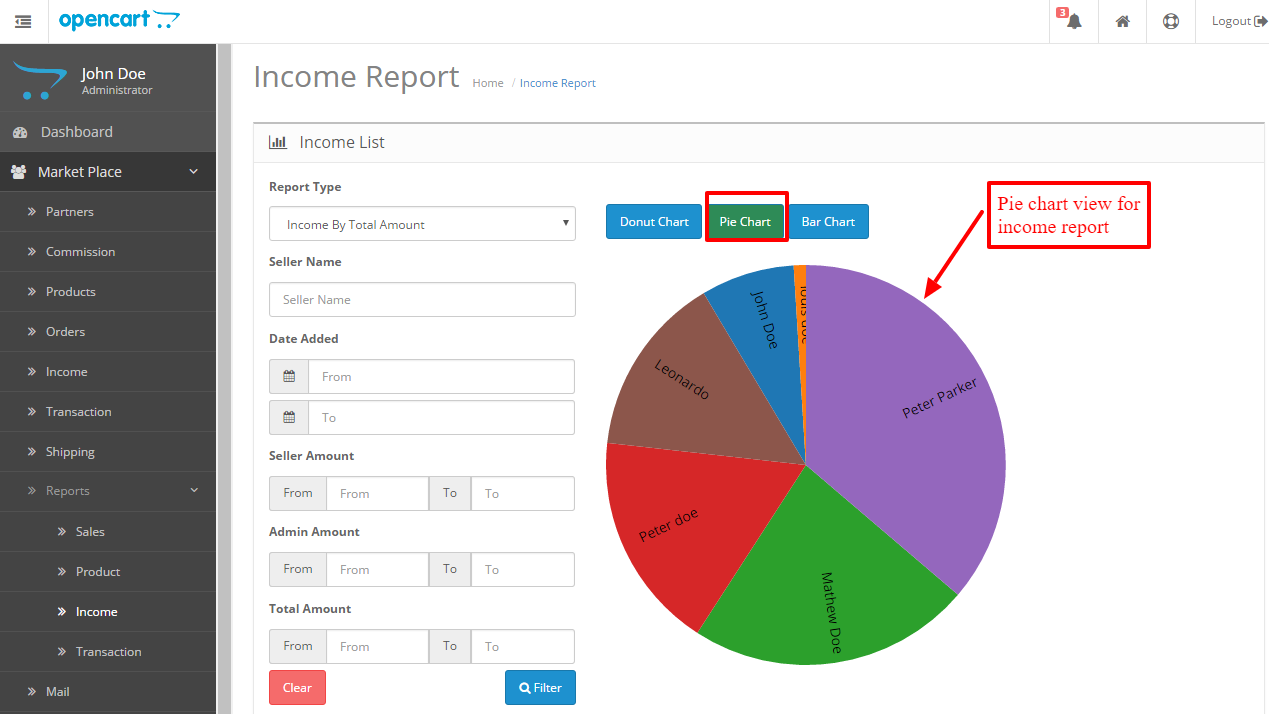
The Admin Can see the pie chart for income reports like this.
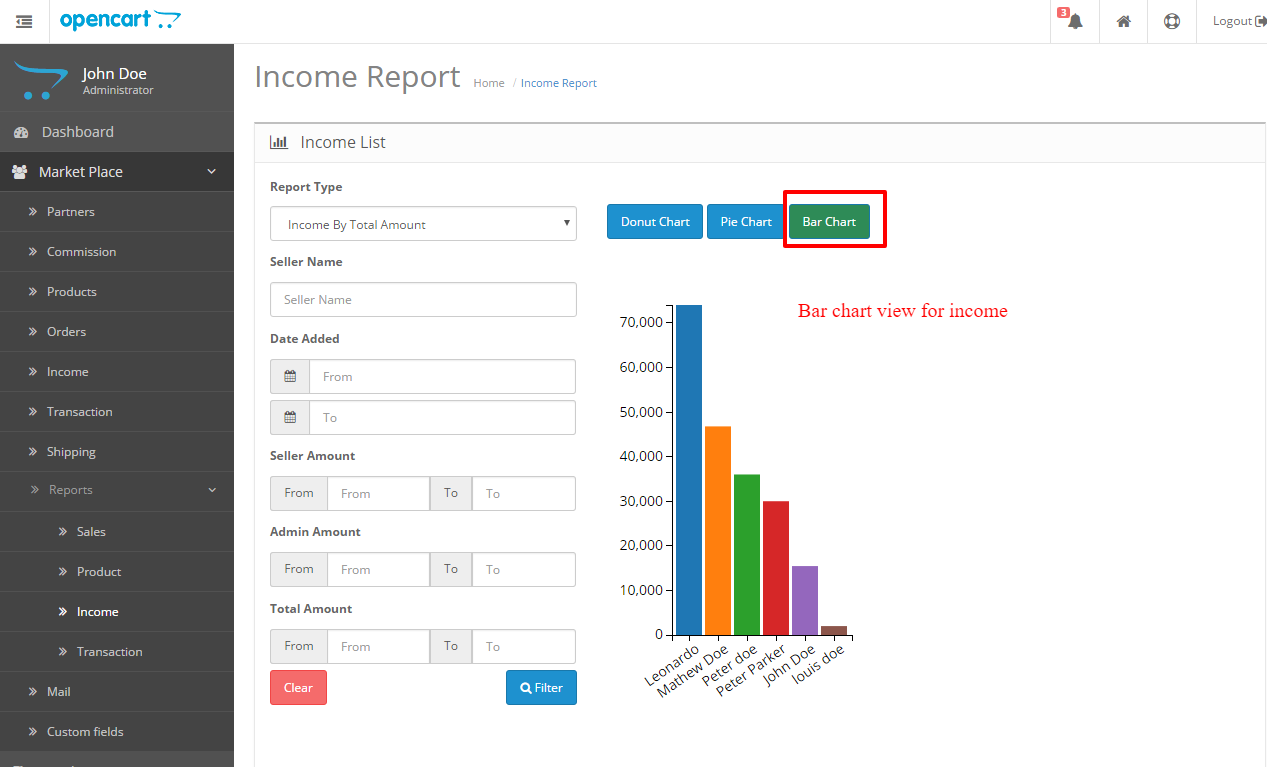
Also, the Admin Can see the bar chart for income reports like this.
Transaction Report For Admin
Admin can see the report for their transactions. To open the report for transaction admin need to navigate to Marketplace->Reporting-> transaction from the admin section.
An admin can see three types of charts for transaction Donut, Pie, and Bar Chart. Also, Admin has many options to filter the report according to their choice.
Below you can see the donut chart for transactions according to quantity.
Admin has the following options to filter the transaction report:
Seller Name: The Admin can filter the report using the seller name.
Transaction Amount: Admin can enter the amount for which they want to see the transaction report.
Comment: Also, Admin can enter the comment for which they want to see the transaction report.
Date Added: Admin can select the date for which they want to see the transaction report.
The Admin can see the pie chart view of the transaction report like this.
Also, the Admin Can see a bar chart view for transaction reports like this.
That’s all for the Opencart Marketplace Report System module, still, have any issue feel free to add a ticket and let us know your views to make the module better https://webkul.uvdesk.com/.
Current Product Version - 3.1.0.5
Supported Framework Version - 2.x.x.x, 3.x.x.x








Be the first to comment.