Introduction
Odoo AI Dashboard: Simplify Data Analysis with AI-Powered Insights!
Odoo AI Dashboard is a powerful tool designed to streamline data analysis using AI and Natural Language Processing (NLP) technologies.
Moreover, it allows you to convert your Odoo data into meaningful visualizations and insights without any technical expertise.
Additionally, with this module, you can easily create interactive dashboards by simply typing your questions. As a result, the system then generates clear visual data, helping you make faster and better business decisions.
For creating lots of high-quality content that people want to read and which helps websites show up in searches, try our Odoo AI Engine (LLM). It’s great!
Prerequisites For Using Odoo AI Dashboard
Odoo AI Dashboard works in conjunction with the following module:
- Python >3.8.1 Is required to install the dependencies
- Install requirements.txt, pip3 install -r odoo_ai_dashboard/requirements.txt
- Generate Groq API key
- Generate OpenAi API Key
The user must have LLM provider API keys for integration
Features
- Uses NLP2SQL technology to convert natural language questions into SQL queries for seamless data retrieval
- Additionally, it automatically generates patterns and insights from your existing Odoo data
- Utilizes large language models for accurate text recognition and query conversion
- Offers dynamic charting tools including bar charts, pie charts, funnel charts, and more
- Create multiple dashboard categories to organize and distinguish different dashboards with independent configurations
- Configure dashboard theme colors for each category directly from the dashboard category form view
- Access a new navbar with dashboard category switcher and essential dashboard tools for quick navigation
- Use dashboard tools including Download (PDF/Image), Send Mail, Edit Mode, Theme changes, and Refresh button
- Display single-value metrics with Tile View featuring pre-defined styled templates, labels, values, colors, and icons
- Select icons using the new Icon Picker designed specifically for customizing tile view displays
- Manage access with role-based groups where Admins have full control and Users can only view and email dashboards
- Supports integration with LLM providers like Groq and OpenAI for AI-powered query processing
- Download dashboards as PDF reports or images for offline sharing and presentations
- Share dashboards directly via email to team members from within the interface
- Enhances clarity and detail in data visualization for better decision-making
Looking to implement ERP in your system? Check out Odoo Implementation! It’s your go-to solution for seamless integration and enhanced efficiency.
Installation
- Once you purchase the App from the Webkul store, you will receive the link to download the zip file of the module.
- Extract the file on your system after the download finishes. As a result, you will be able to see a folder named- ‘odoo_ai_dashboard’
- Copy and paste this folder inside your Odoo Add-Ons path.
- Now, open the Odoo App and click on the Settings menu. Here, click on Activate the Developer Mode.
- Then, open the Apps menu and click on ‘Update Modules List.’
- In the search bar, remove all the filters and search ‘odoo_ai_dashboard’
- You will be able to see the module in the search results. Click on ‘Install’ to install it.
Before moving further, explore our Odoo development services & an extensive range of quality Odoo Apps.
Workflow
- Configuration
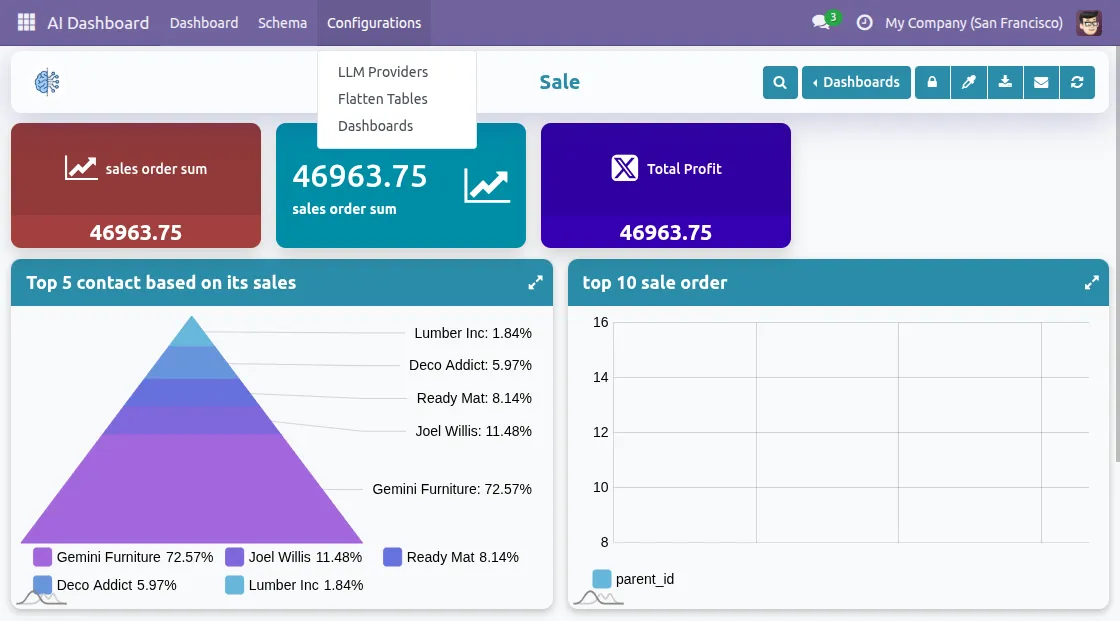
- After installing Odoo AI Dashboard module, log in as admin. First, navigate to the AI Dashboard menu and then click on Configuration tab.
- A dropdown will open with three options: LLM (Large Language Model), Flatten Table and Dashboard.
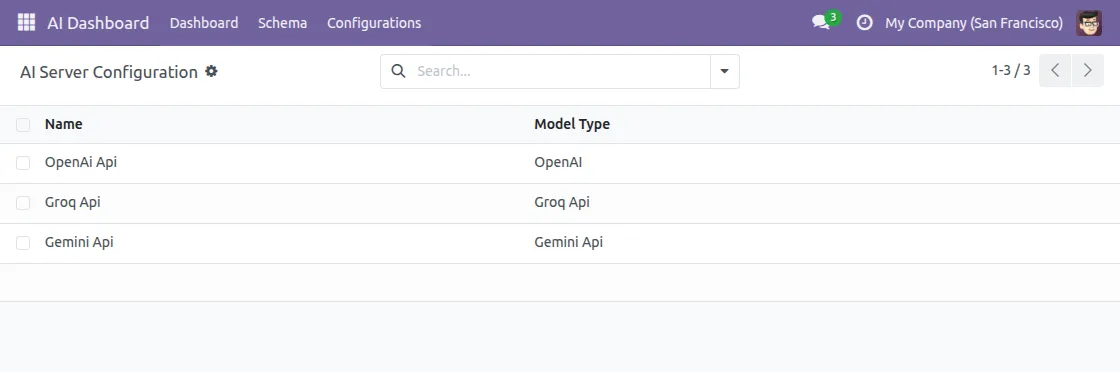
2. View Existing LLM Providers
First, click on LLM to view all existing large language model providers configured in your system. Here, you can see the list of providers already added along with their details.
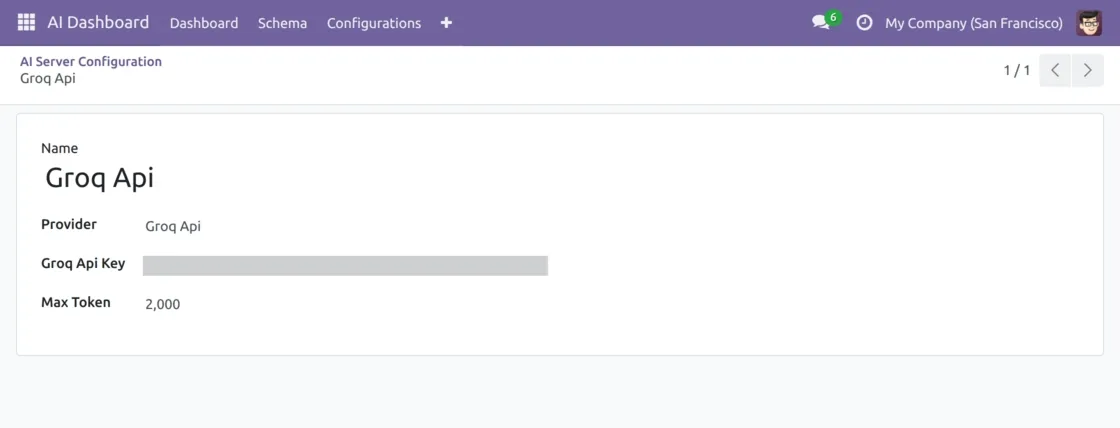
3. Create a New LLM Provider
To add a new provider, click New, enter the provider name, and add the API key. Once done, save the record to proceed.
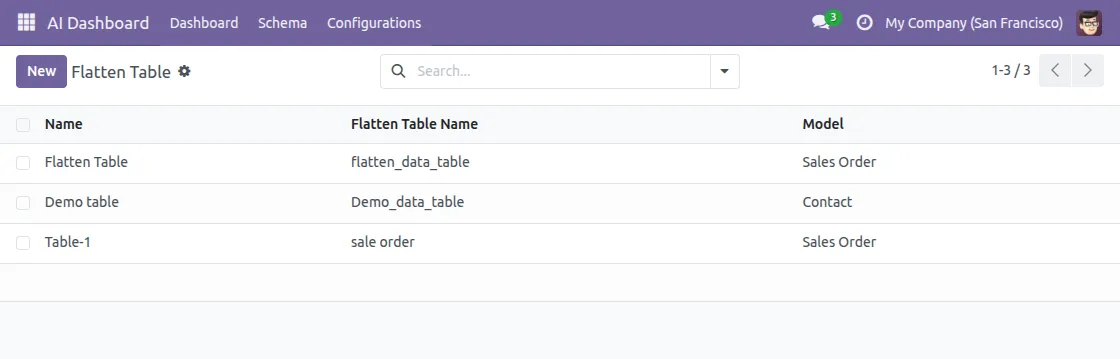
4. View Existing Flatten Tables
Next, go back to Configuration and click on Flatten Table from the dropdown. Here you can view all existing flatten tables that have been created in your system.
5. Create a New Flatten Table
Click New to create a new table, fill in all the required details, and select models you want to include. Once all information is entered, click Create Table.
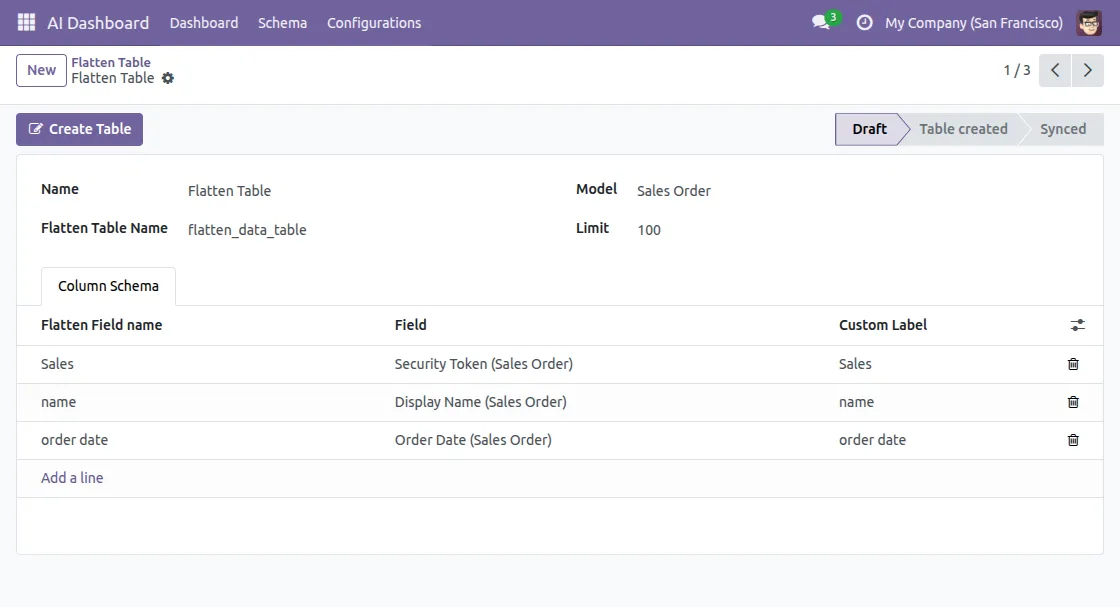
6. Table Created Successfully
The system will then automatically generate table for you. Once the process is complete, you will see a confirmation that table has been created successfully.

7. Sync the Data
After creating table, click on Sync to sync all the details in backend. The system will process and confirm once information has been successfully synced.

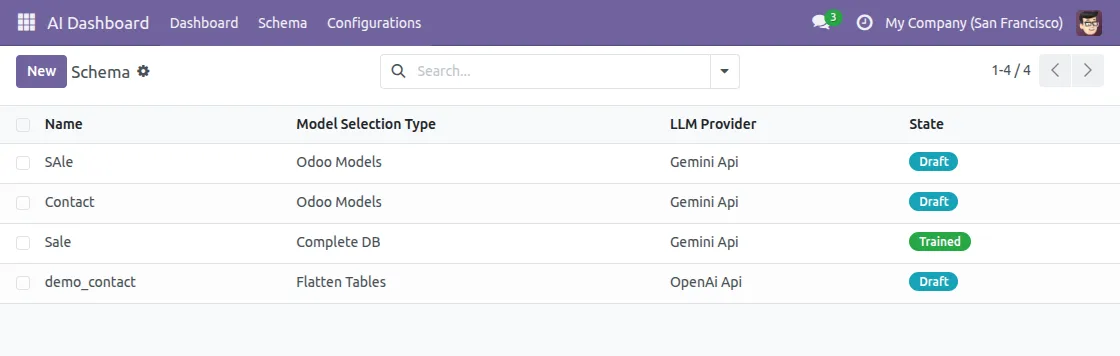
8. View Existing Schemas
Now, click on the Schema tab in the navigation bar to view all existing schemas in your system. Here, you can check the status of schemas and see which ones are active or trained.
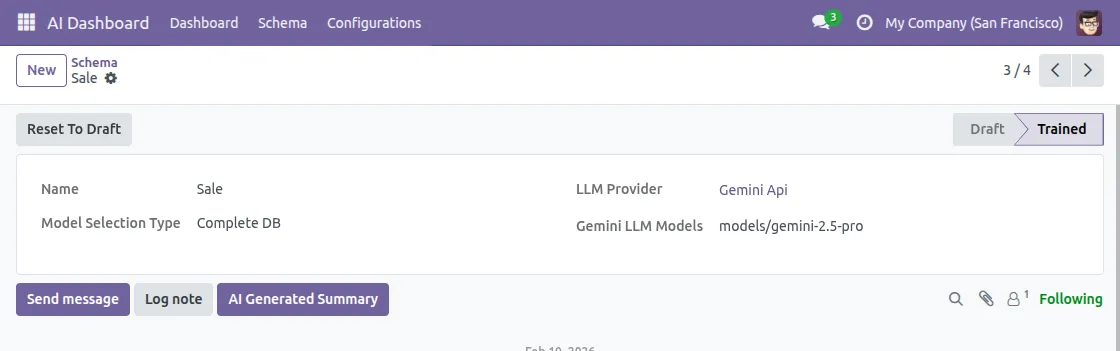
9. Create and Train a New Schema
Click New to create a new schema, fill in all the schema details, and then click Train to train AI about your database.
| * Note- only one schema can be trained at a time, so existing schemas should be in an inactive stage in order to train the current/new schema. * |
Searching queries and creating visual representations
10. Search and Visualize Data
Once training is complete, go to AI Dashboard and click on Search. Then, type your question in plain English, such as “What are top 5 sale orders with amount?”, and press enter.
The system will process the query based on trained backend data and display the results instantly.
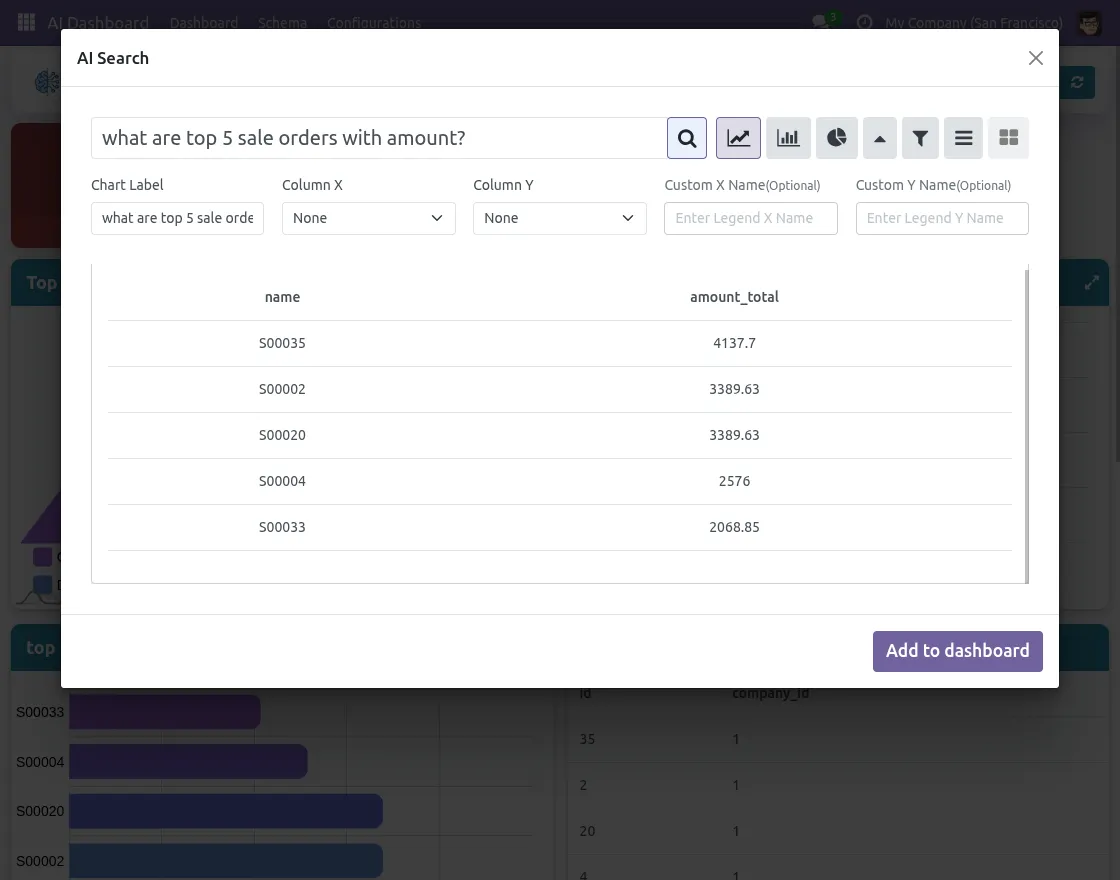
11. Select a Visualization Type
After results appear, select how you want the data to be visualized. Several options are available, including bar chart, pie chart, funnel chart, and more.

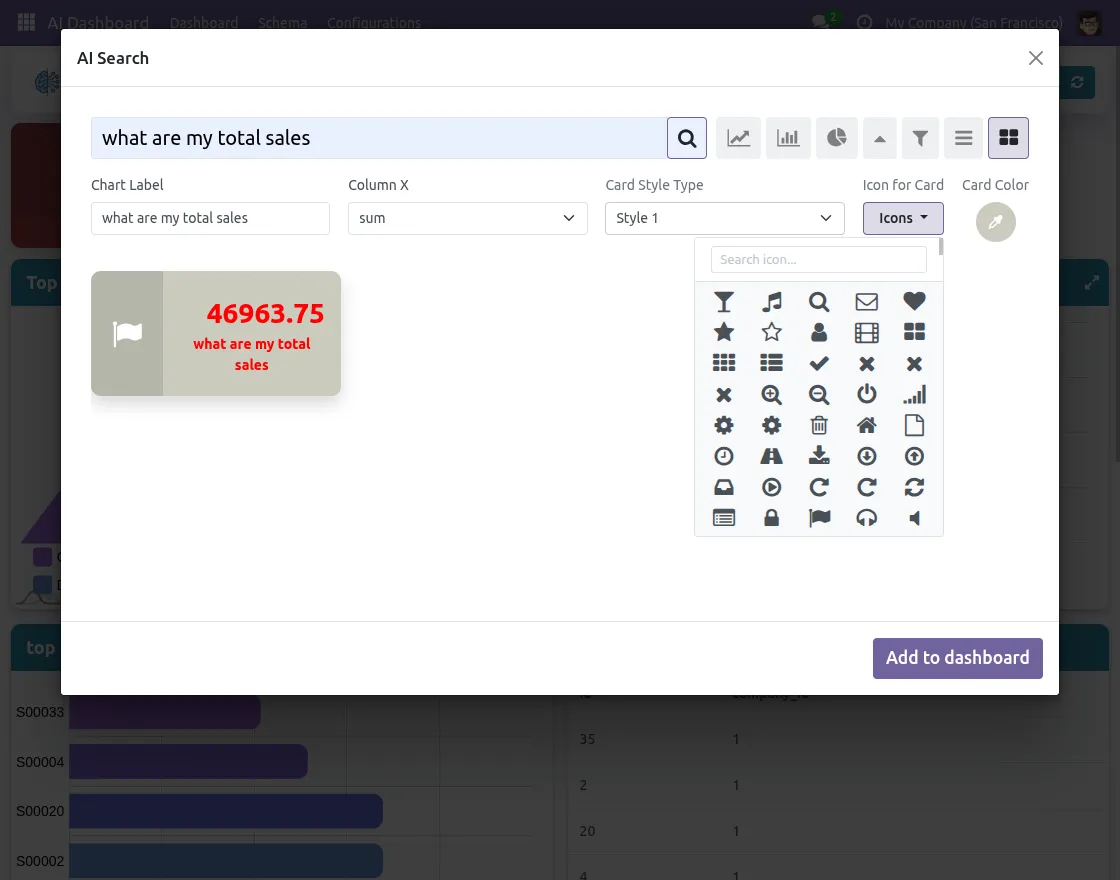
12. Customize Tile Appearance
For tile visualizations, first select your preferred Card Style Type, then choose an icon from the icon picker, and finally pick a custom card color.
Additionally, the system offers multiple style templates, icons, and color options to create professional and visually clear metric tiles.
13. Add to Dashboard
Finally, click on Add to Dashboard, and system will automatically add the selected chart to your AI Dashboard. Within just a few minutes, you can build a complete and interactive dashboard using the power of AI.
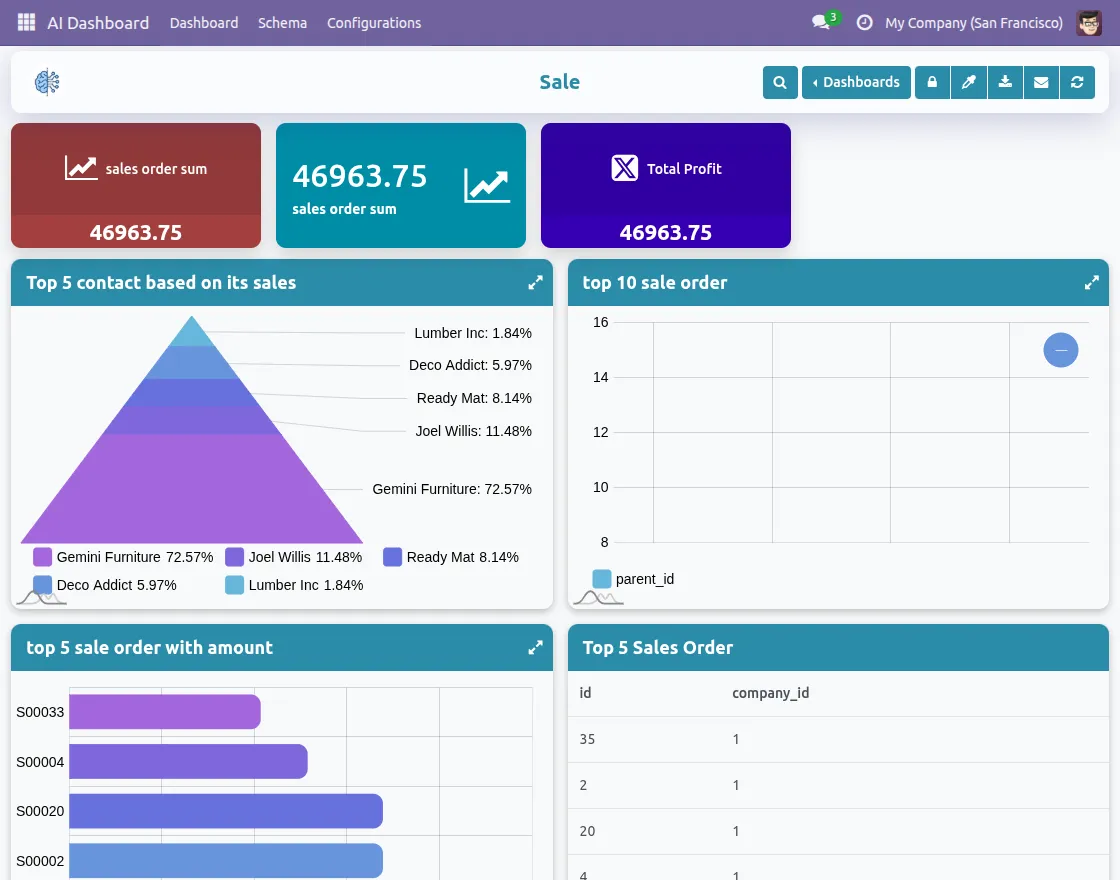
Using this module the user can create an interactive dashboard in just a few minutes with the help of AI .
Webkul, an official Odoo partner and Odoo development company, provides a wide range of development services, including SaaS solutions, data migrations, mobile app development, and more.
Need Help?
Hope you find the guide helpful! Please feel free to share your feedback in the comments below.
If you still have any issues/queries regarding the same, please raise a ticket at the UV Desk.
I hope this helps. In case of any further queries, contact us at our support mail.
Thanks for paying attention!!
Current Product Version - 1.0.4
Supported Framework Version - Odoo V17, V18, V19

Be the first to comment.