Magento 2 (Adobe Commerce) Power BI connector extension enables the connection between your Magento 2 e-commerce platform and Microsoft Power BI, a business intelligence and data visualization tool.
The extension facilitates the seamless transfer of relevant data from your Magento 2 store to Power BI for in-depth analysis, reporting, and visualization.
The admin can export the order and invoice-related data to Power BI.
After data has been exported to Power BI, the admin can generate reports and dashboards at the Power BI console and these can then be accessed directly from the Magento backend.
Features
- Connect your Magento 2 store securely with Microsoft Power BI using OAuth 2.0 authentication.
- View real-time store metrics, sales trends, and performance indicators directly from the native Magento Analytics Dashboard.
- Create and export datasets for Orders, Invoices, Products, Customers, Categories, Coupons, Refunds, and more to Power BI.
- Build custom data queries using the Visual Query Builder — no coding or SQL knowledge required.
- Save reusable Load Profiles to define what data to extract and where to send it in Power BI.
- Automate data sync to Power BI on Hourly, Daily, or Weekly schedules using the built-in Scheduler.
- Visualize Power BI reports and dashboards directly from the Magento 2 backend without switching platforms.
- Set up Smart Alerts to receive automatic email notifications when key business metrics cross a defined threshold.
- Monitor all data sync attempts with detailed Sync Logs showing success, failure, and error messages.
- Automatically recover failed sync jobs using the built-in Retry Queue — no data is permanently lost.
- Ensures seamless Power BI integration by automatically refreshing expired OAuth tokens in the background.
- Supports Full Sync, Incremental Sync, and Live Sync modes for flexible data pipeline management.
Installation
#Download Module
Firstly, you need to log in to Webkul Store, go to My Account>My Purchased Products section, verify and then download and extract the contents of this zip folder on the system.
#Upload Folder
Once the module zip extracts, follow path src>app and then copy the app folder into the Magento 2 root directory on the server as shown below:

#3 Run Commands
You need to run the following commands:
php bin/magento setup:upgrade
php bin/magento setup:di:compile
php bin/magento setup:static-content:deploy
php bin/magento indexer:reindex
php bin/magento cache:flush
php bin/magento cron:install
php bin/magento cron:run
php bin/magento wkpbic:sync --id=<PROFILE_ID>
php bin/magento wkpbic:sync --id=<PROFILE_ID> -vvv
php bin/magento wkpbic:alerts:check
php bin/magento queue:consumers:start powerbi_data_push_consumer
Language Translation
For translating the module language, navigate through src/app/code/Webkul/PowerBiConnector/i18n and edit the en_US.csv file.
Thereafter, rename the CSV as “en_SA.csv” and translate all right side content after the comma in the Arabic language. After editing the CSV, save it.

Now, upload it to the path src/app/code/Webkul/PowerBiConnector/i18n where the installation of Magento 2 is on the server.
The module translates into the Arabic Language. It supports both RTL and LTR languages.
The user can edit the CSV like the image below.

How to get the Credentials?
First of all, you must have a Microsoft Outlook account to access the Power BI account and the Microsoft Azure account
(to create the application there to get the API credentials to be used while configuring at Magento 2 backend).
To create a Microsoft Outlook account, tap this link.
Generate the keys at Azure :
Navigate to the Microsoft Azure login section, and tap on the Sign In option in the top right-hand corner.

This brings the section to sign in with the Microsoft account. Here, enter the details and tap the next button. After that, enter your password and tap the Sign in button.

After signing in, go to all services and tap the Active Directory option.

This brings up the below section. Here tap on the App registrations option on the side panel.

After that, tap the New Registration option to register a new app. Now, enter the app name choose the supported account types, and tap the Register button after that.

Thereafter, you can see the credentials being generated for the application that we created.

Now here, you will get the –
- Client ID
- Tenant Id
How to get the Client Secret:
Now, in the same side panel section, go to Certificates & Secrets and tap the New Client Secret option.

This brings the section to add a description for the Client secret, enter the same, and tap the Add button after that.

After tapping the Add button, the Client’s secret key will be generated.

Note: You need to copy the Value for the secret key. This is displayed only once, so copy it somewhere safe for use at a later time in the extension configuration part.
Configure Platform & Set Redirect URL:
Now, on the side panel for the app, go to Authentication->add a platform->web.

After tapping on the Web, you have to enter the redirect URL. Enter the base URL of your website like www.example.com/ and give the permissions and tap the Configure button for the app.

Initial Configuration Settings
General Settings:
After successfully installing the Power BI Connector module, the admin can navigate to: Stores → Configuration → Webkul → Power BI → General Settings.

The following configuration options are available for the admin:
- Enable: Dropdown to enable or disable the Power BI Connector module globally across the store.
- Client ID: Text field to enter the Application (Client) ID generated inside your Azure App Registration.
- Client Secret Key: Obscured text field to enter the Client Secret Value generated under Certificates & Secrets in Azure.
- Power BI Tenant ID: Text field to enter the Directory (Tenant) ID representing your Azure AD environment.
- Token: Displays the active bearer token received from Microsoft identity servers after a successful connection.
- Refresh Token: Displays the stored token used by the background Cron Job to silently maintain connectivity when the primary token expires.
- Token Expiration (Unix Timestamp): Indicates the expiry time of the current access token and updates automatically after refresh.
- Connect to Power BI: Button to initiate the OAuth 2.0 Authorization Code Flow. Clicking this redirects the admin to Microsoft Login for authorization approval.
After entering all the data, click the Connect to Power BI button to initiate the connection between your Magento store and Microsoft Power BI account.
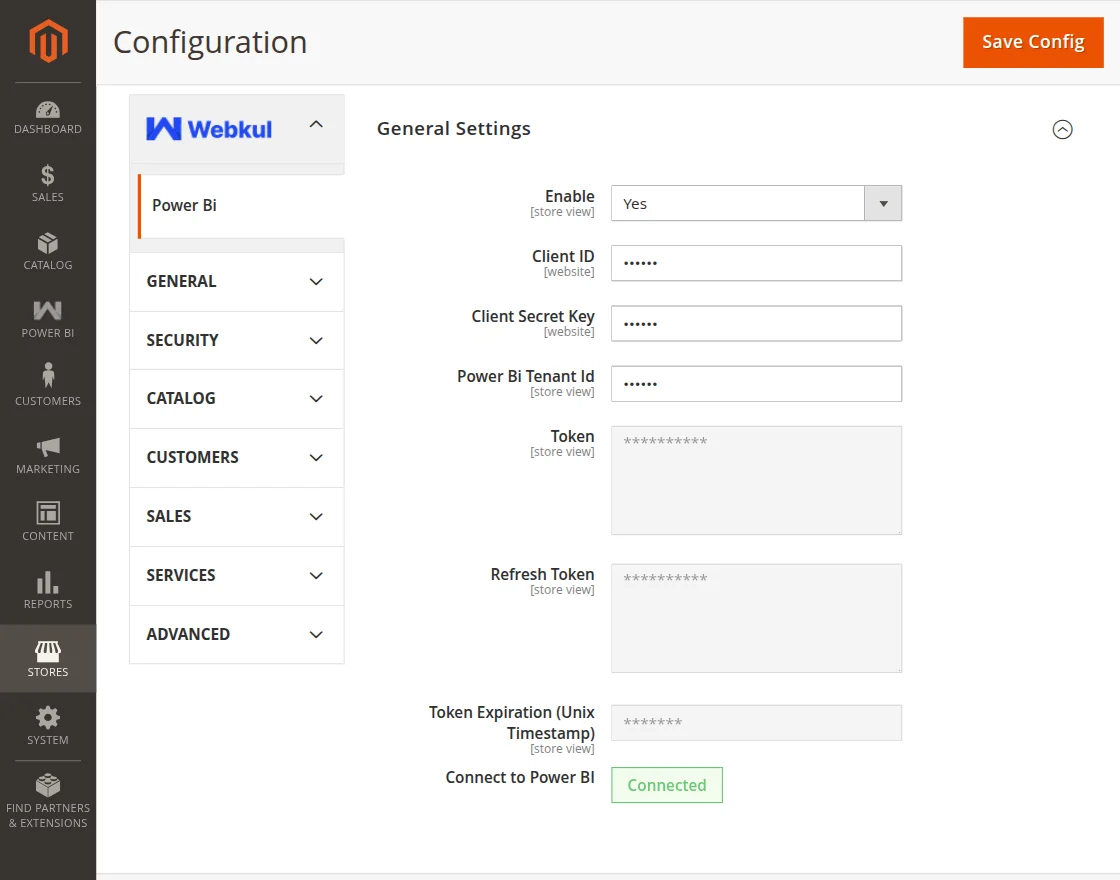
Now, the Token, Refresh Token, and Token Expiration will automatically be generated.
Lastly, Save the configuration settings.
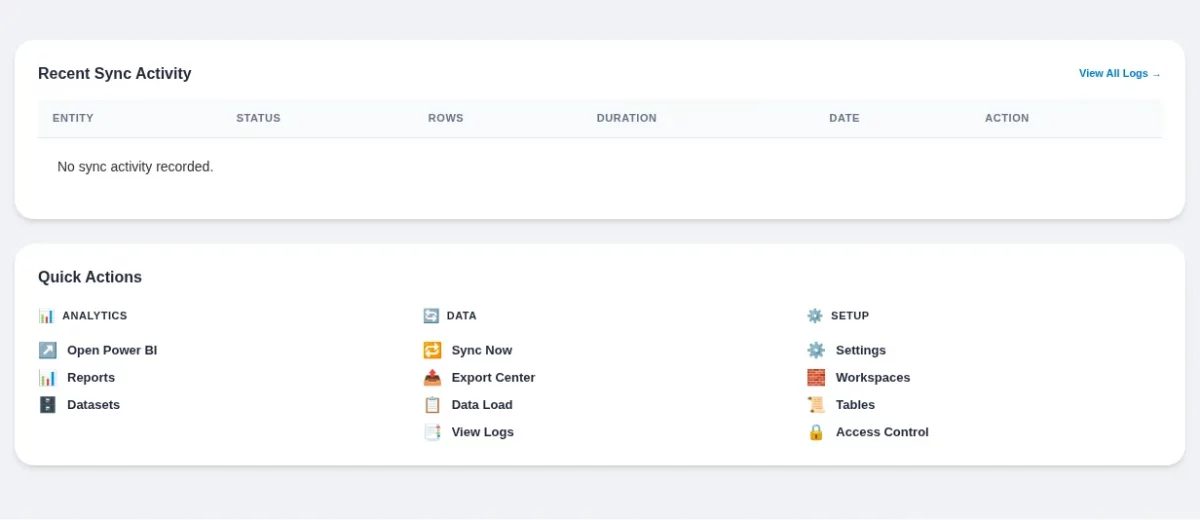
Admin Options – Magento 2 Power BI Connector
After the successful installation and enabling of the extension from the initial configuration settings, the admin can see a Power BI option and different options under that as per the snapshot below.
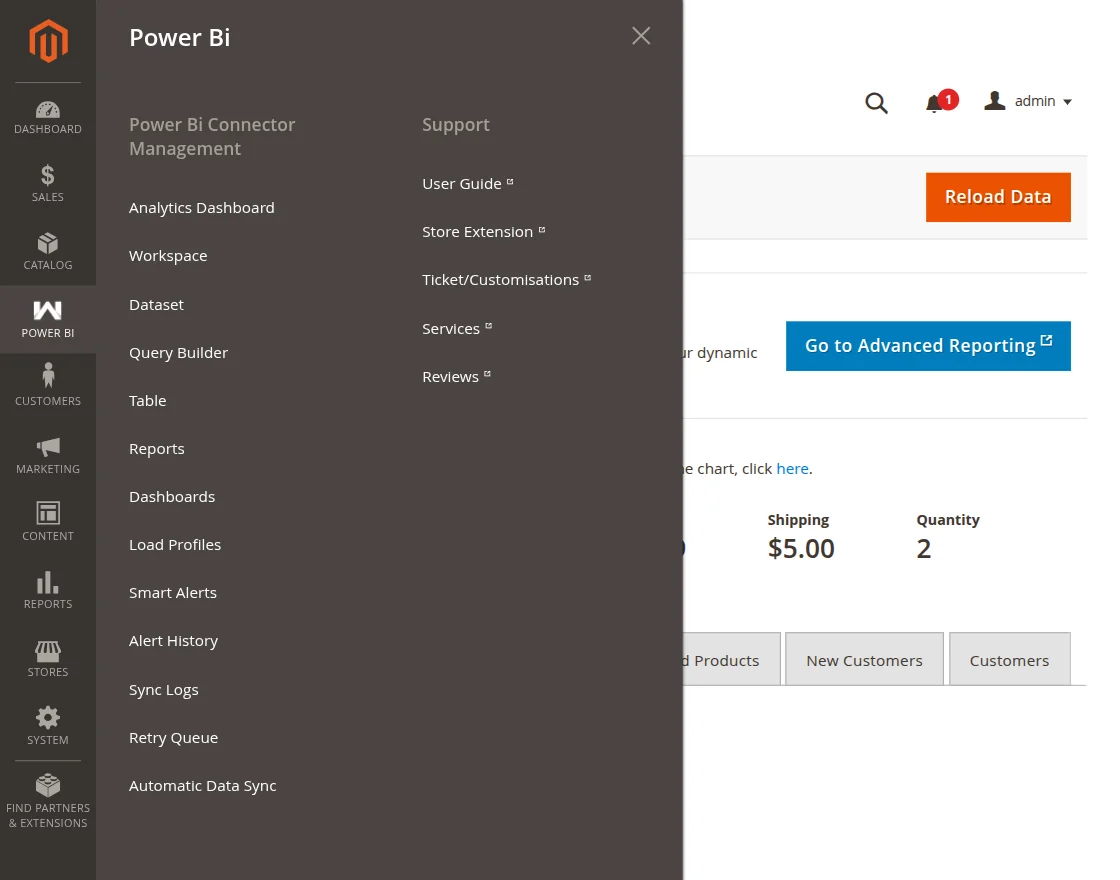
This has the following sections:
- Analytics Dashboard: View your store’s key sales metrics, trends, and performance indicators directly inside Magento.
- Workspace: A dedicated folder on Power BI that holds all your store’s datasets, reports, and dashboards in one place.
- Dataset: A container inside a Workspace that defines the structure of your Magento data before it is pushed to Power BI.
- Query Builder: A visual tool to select columns, apply filters, and preview your data.
- Table: The actual store data (Orders, Customers, Products, etc.) stored inside a Dataset and sent to Power BI.
- Reports: View your Power BI reports directly inside the Magento admin panel without switching platforms.
- Dashboards: View your Power BI dashboards embedded inside Magento for a quick overview of store performance.
- Load Profiles: A saved data rule that tells the module what data to extract and where to send it in Power BI.
- Smart Alerts: Get notified automatically when a key business metric crosses a limit you define.
- Alert History: See a full list of all past alerts that were triggered.
- Sync Logs: Check which data syncs passed or failed, along with error details.
- Retry Queue: Re-run any failed sync jobs with a single click.
- Automatic Data Sync: Schedule automatic data updates to Power BI — Hourly, Daily, or Weekly.
Analytics Dashboard
Under this section, the admin can view real-time sales metrics and store performance insights directly from the Magento backend without opening Power BI.
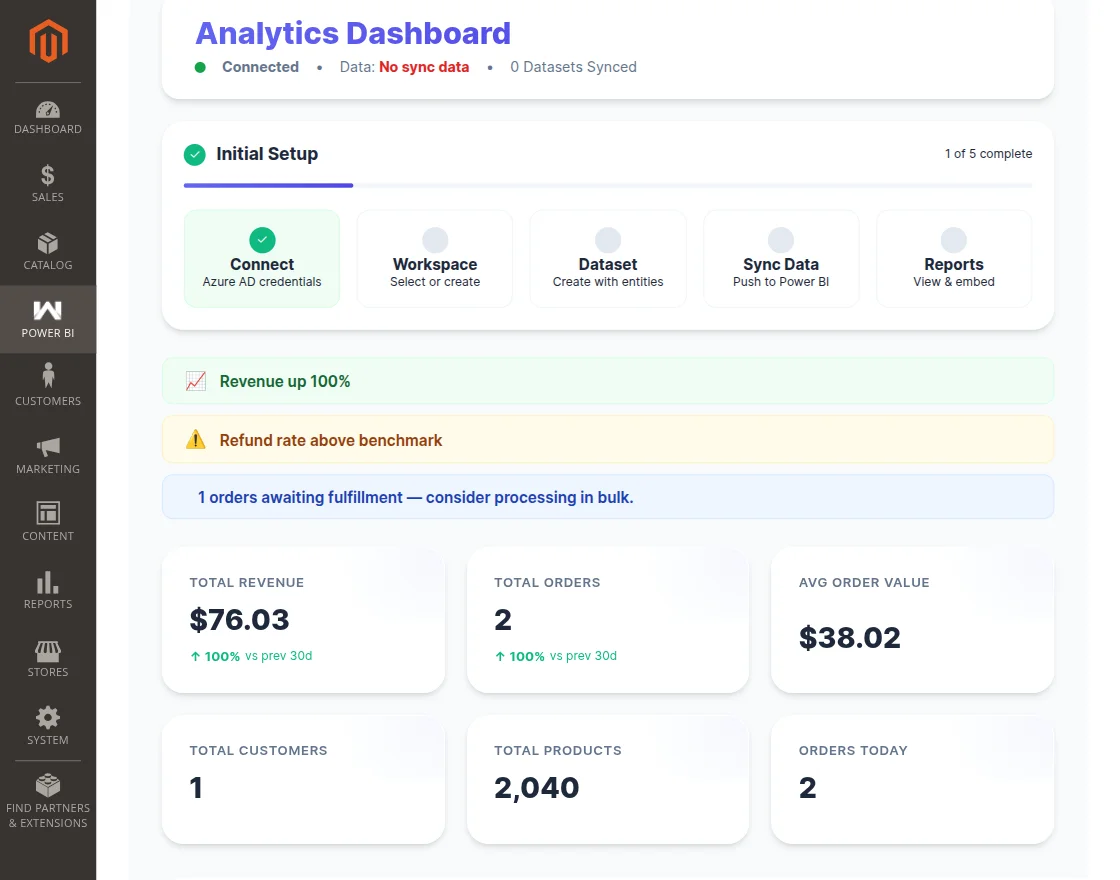
1. Setup Progress Tracker
Located prominently at the top for new installations, this vertical stepper tracks mandatory configuration stages:
- Azure AD Setup: Confirms if Client keys exist.
- Authentication: Confirms if the OAuth token flow completed successfully.
- First Sync Profile: Detects if you created a Query Profile.
- Initial Sync: Marks complete after the very first chunk of data reaches Microsoft.
Once all steps turn green, the tracker collapses to conserve screen real estate.
2. Connection Metrics Bar
Displays real-time integrity indicators computed directly by the helper system:
- Connection Integrity: Displays a live
ConnectedorDisconnectedstate verified against current API tokens. - Sync Schedule Status: Indicates whether Magento Cron triggers are properly processing queues.
- Data Freshness: A time-drift calculator showing how many minutes/hours have passed since the latest outbound push.
3. Key Performance Indicators (KPIs)
Interactive cards located mid-page compute totals dynamically over the standard Last 30 Days window:
- Total Revenue: Sum of invoiced grand totals (excluding refunds).
- Total Order Count: Aggregate order volume count.
- Average Order Value (AOV): Total Revenue divided by Total Order Count.
- New Customer Registrations: Count of recently registered store accounts.
Historic Benchmarking
Each card automatically calculates the percentage delta ($\Delta$) comparing the current 30-day window to the preceding 30-day period, visually rendered in Green (Increase) or Red (Decrease).
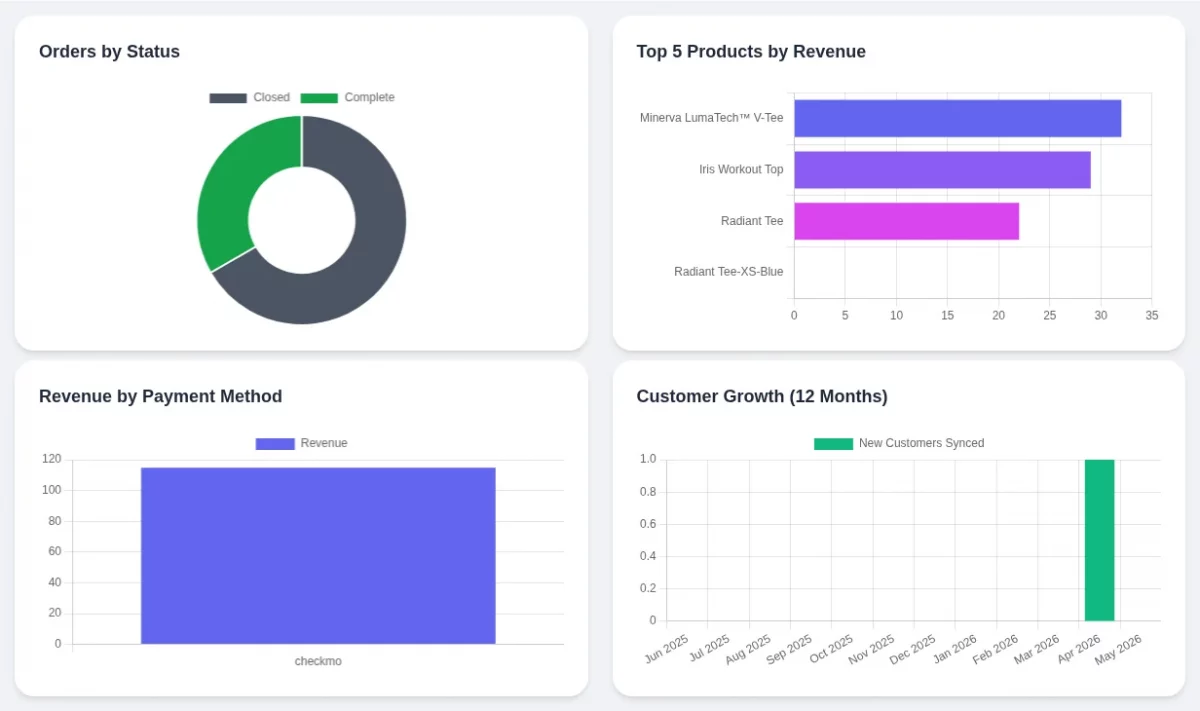
4. Native Visualization Charts
The core analytics viewport visualizes high-density transactional timelines seamlessly integrated with operational health telemetry:
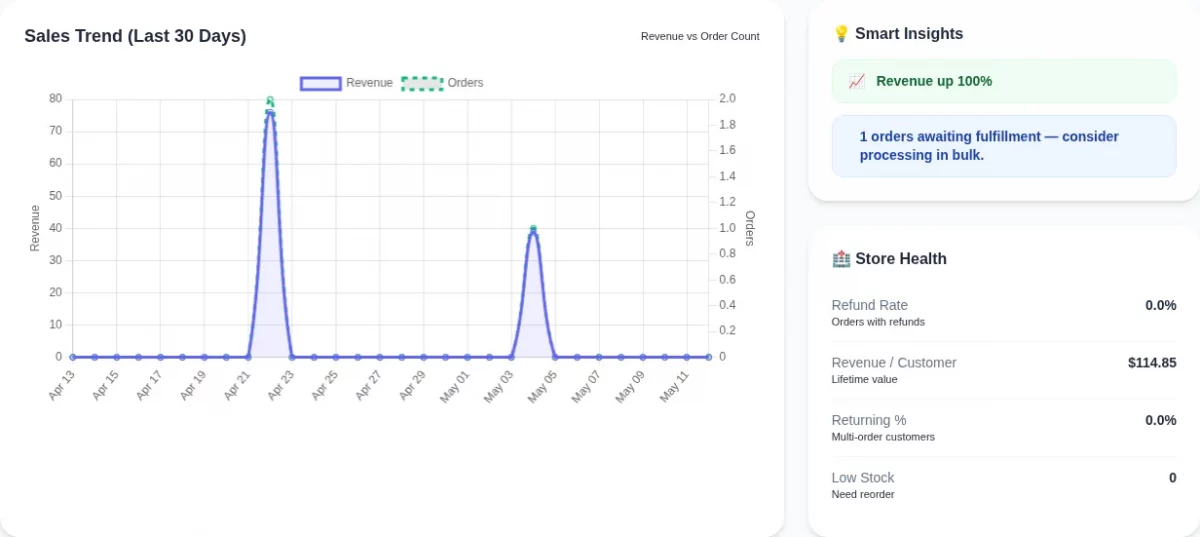
Below the KPIs, the module leverages optimized Javascript rendering (via Chart.js integration) to present five primary visualizations:
| Chart Widget | Rendering Type | Dataset Visualized |
|---|---|---|
| Sales Trends | Dual-Axis Line | Overlays daily Revenue (bar) vs daily Order Count (line). |
| Order Splitting | Pie / Doughnut | Partitions orders by state (e.g., Pending, Processing, Complete, Closed). |
| Top Performers | Horizontal Bar | The Top 5 Product SKUs by cumulative gross revenue. |
| Revenue Sources | Donut | Grouping of totals aggregated by active Payment Gateway IDs. |
| Customer Growth | Line Chart | Tracks monthly acquisition volumes across the last 12 months. |
5. Store Health Matrix
Unlike standard sync lists, this pane gives actionable inventory alerts:
- Low Stock Inventory: Count of catalog items currently below defined quantity thresholds.
- Out of Stock: Count of globally disabled SKUs.
- Processing Bottlenecks: Count of Orders resting in intermediate states needing attention.
6. Sync History & Realtime Actions
The footer displays the most recent system-to-system synchronization log payloads:
- Entity Type: Category, Product, etc.
- Status Indicator: Success, Failed, or Warning.
- Execution Duration: Milliseconds elapsed.
Workspace
Under this section, the admin will find all of the created workspaces if any. The admin can edit and delete the workspaces as required.
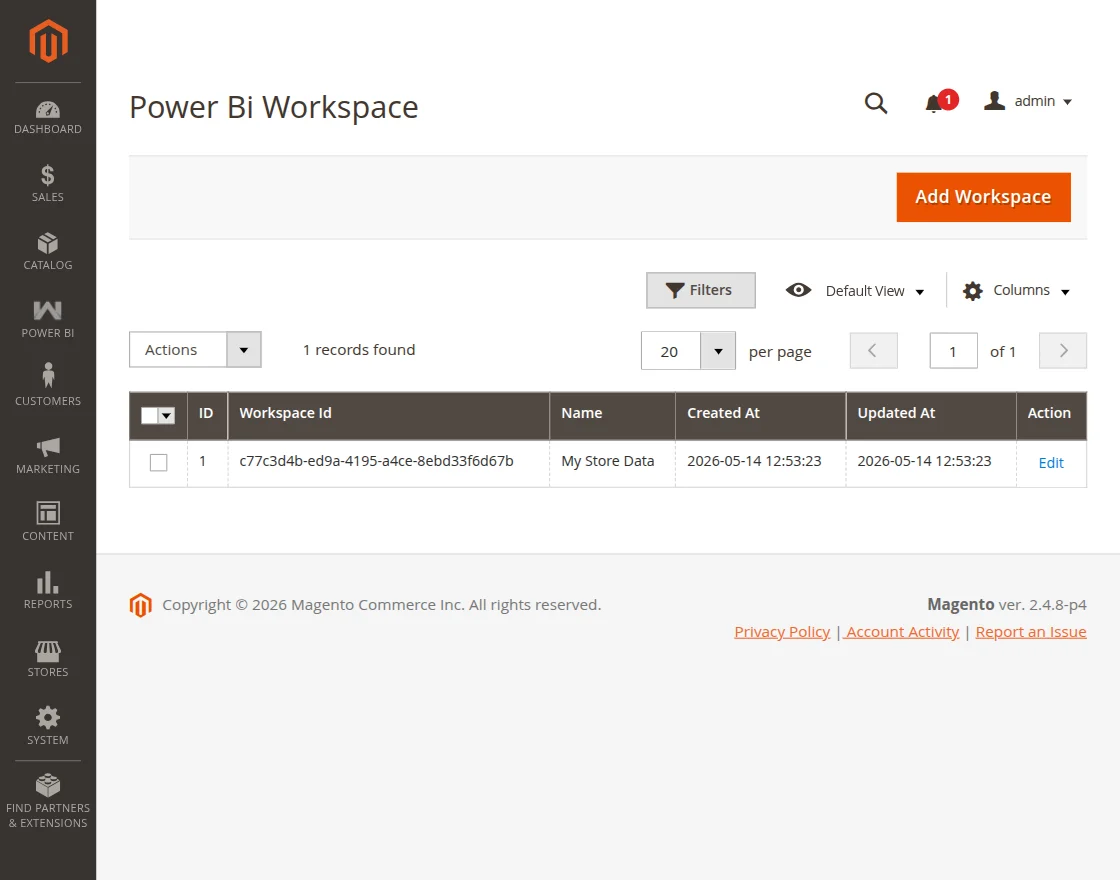
Add Power BI Workspace:
To create a Workspace tap the Add Workspace button and that opens the below section.
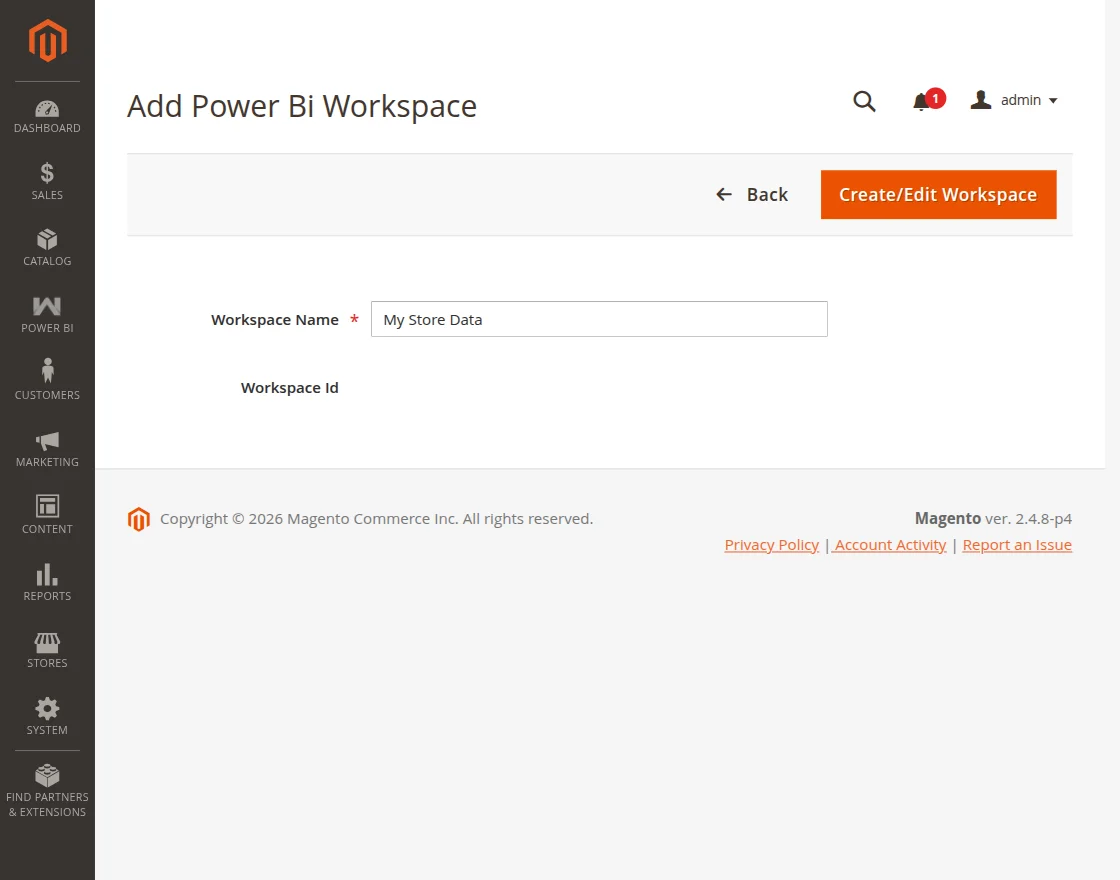
Enter the workspace name and tap the Create/Edit Workspace button to save the workspace.
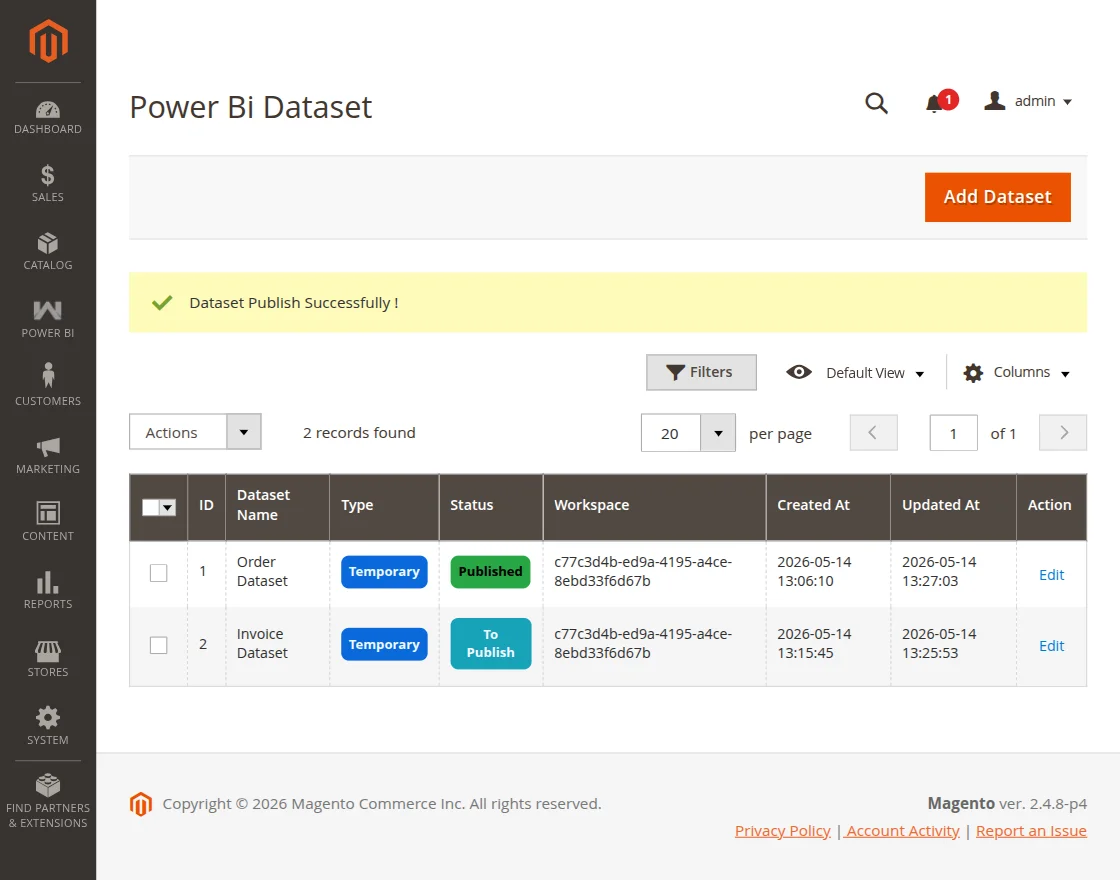
Datasets
Under this section, the admin can view and manage all datasets published to Power BI.
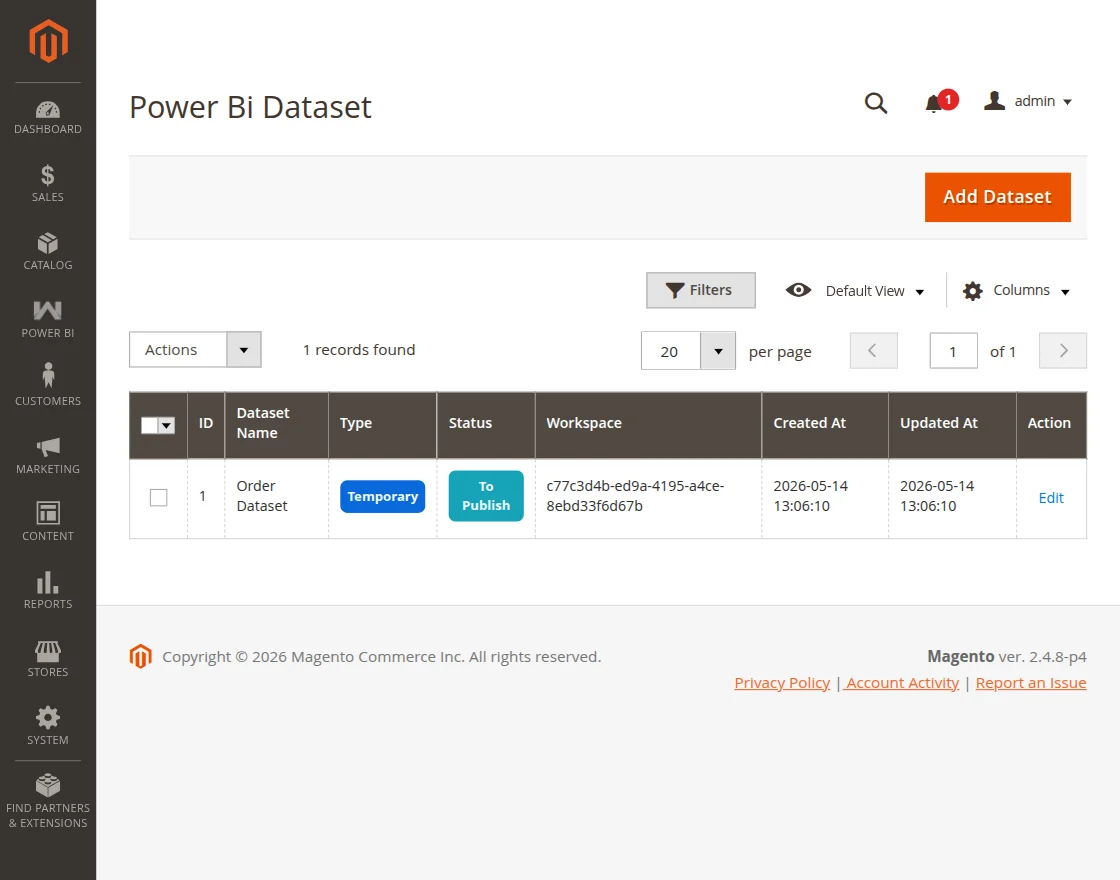
The admin can add, edit, or delete the datasets as required.
To add a new dataset tap the Add Dataset button and that brings up the below section.
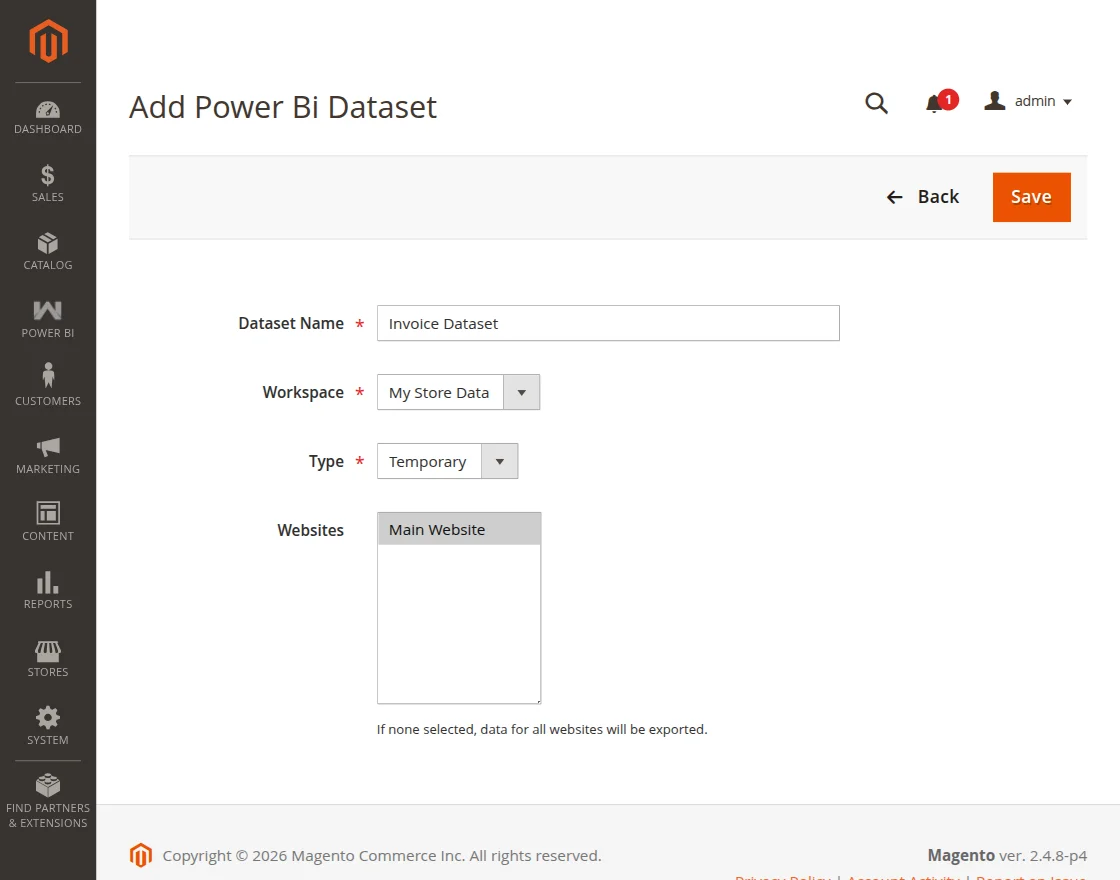
Here, for the dataset the admin will –
- Enter the Dataset name
- Choose a Workspace from the list of already created ones.
- Choose the type as temporary or permanent as required.
- Select one or more Magento stores to include in the dataset.
Lastly, save the dataset.
After saving the dataset it will gets displayed under the list of the datasets.
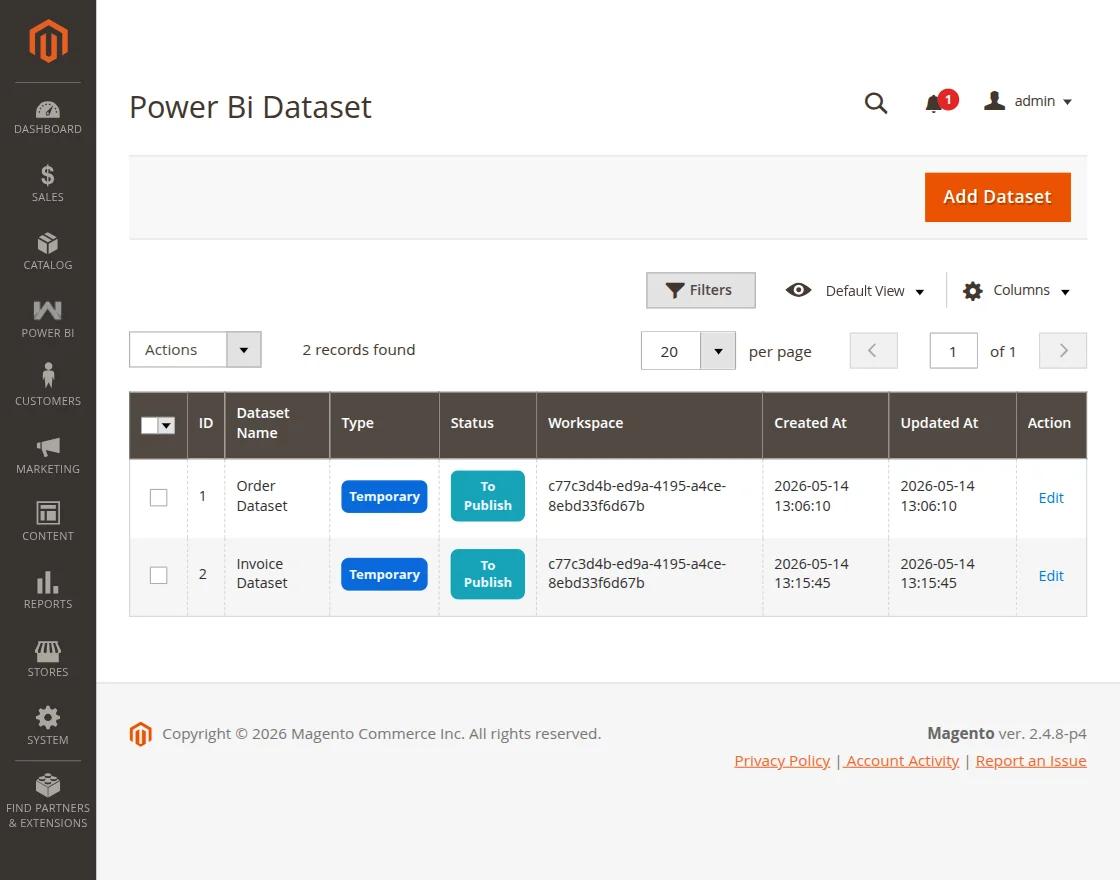
The status will be To publish when you create the same for the first time.
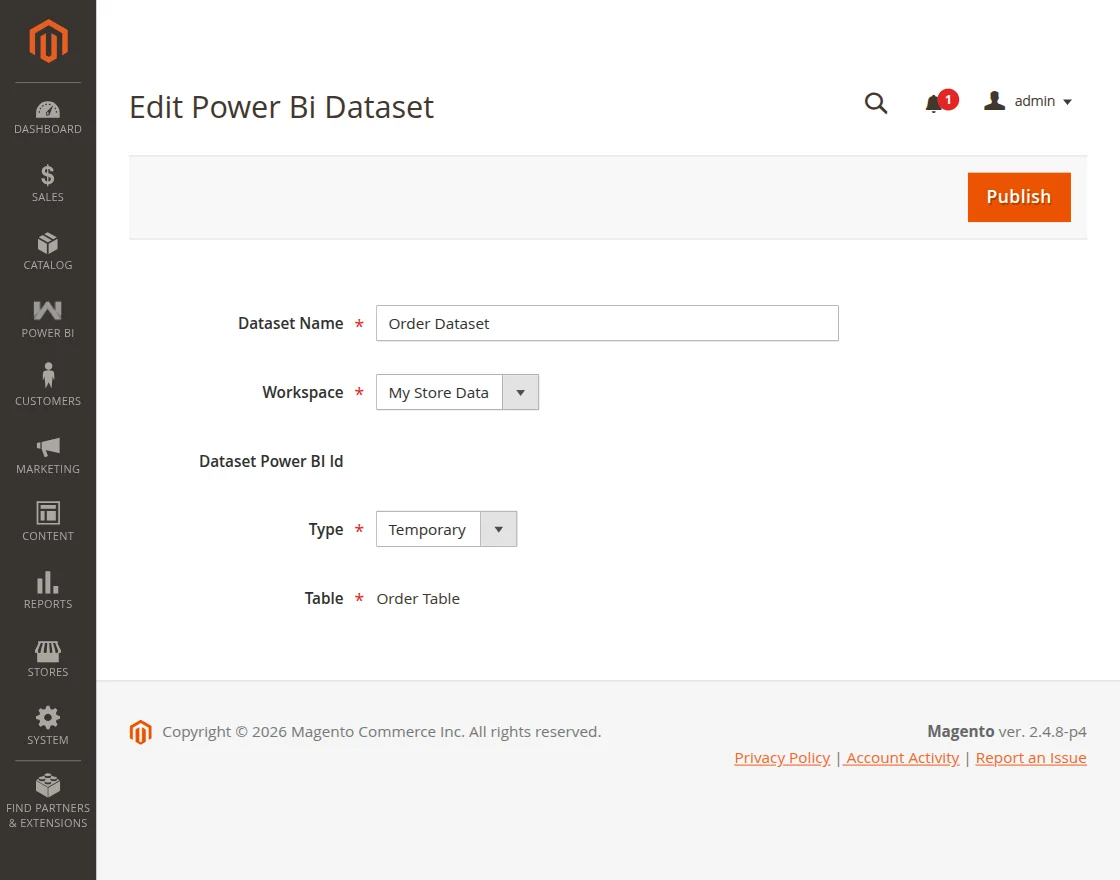
To publish it, first you need to create a table for the same and then you can come back to this section and publish it thereafter.
To publish the dataset, click on edit button and just tap on the Publish button.
After publishing you can see the success message for the same.
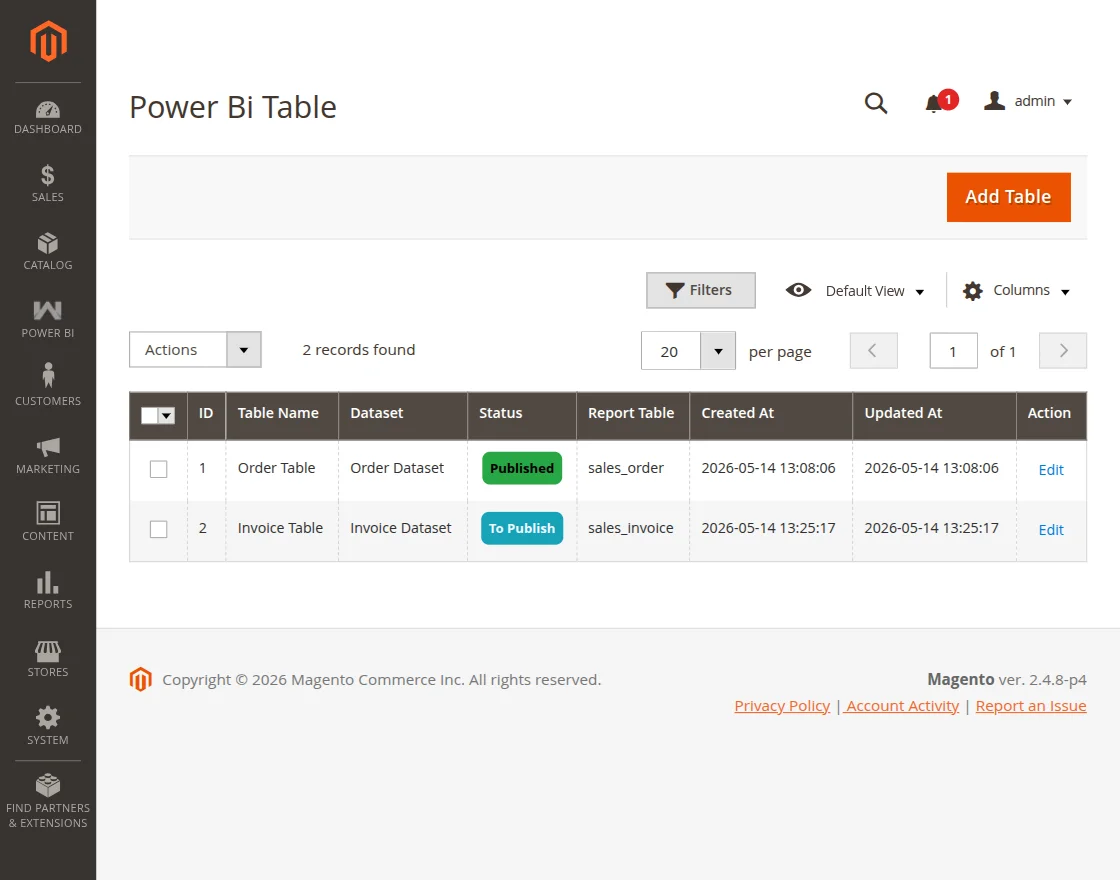
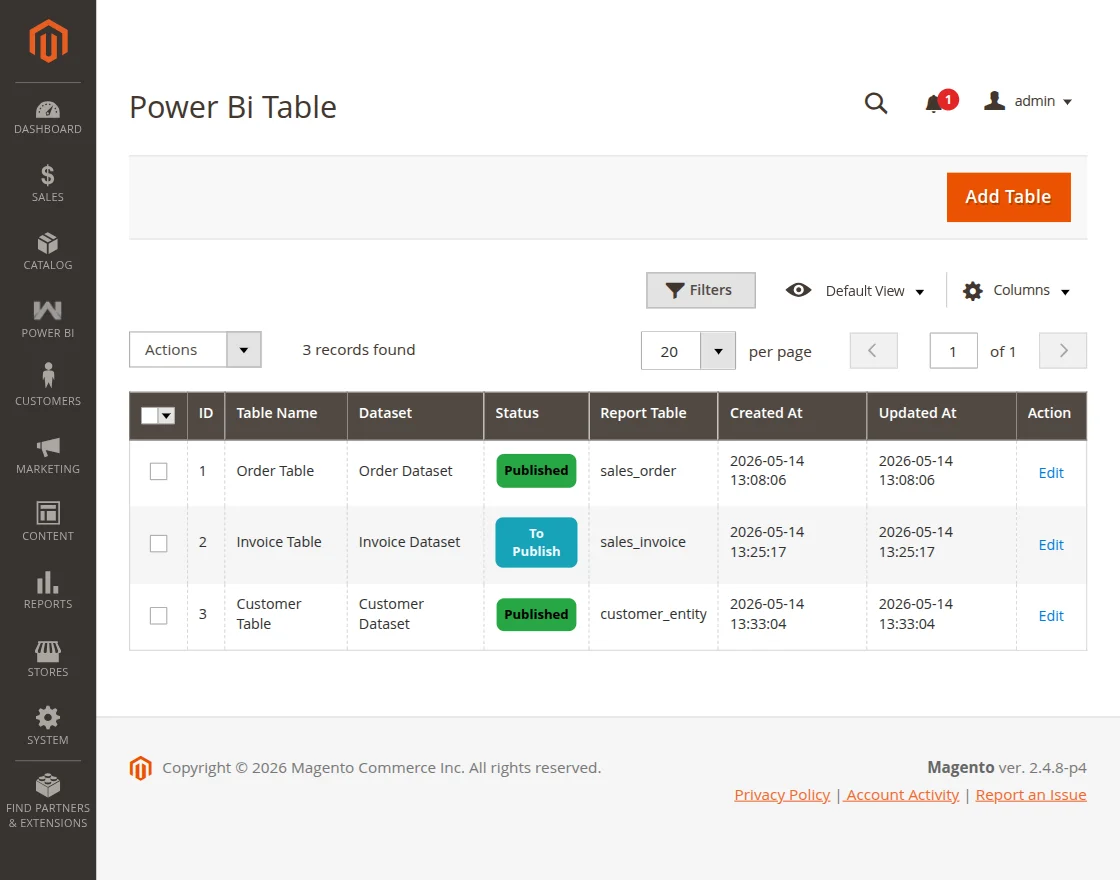
Table
Here, the admin will find all of the tables created. The admin can edit, delete or add a new table as required.
To add a new table tap on the Add Table button and that brings up the below section.
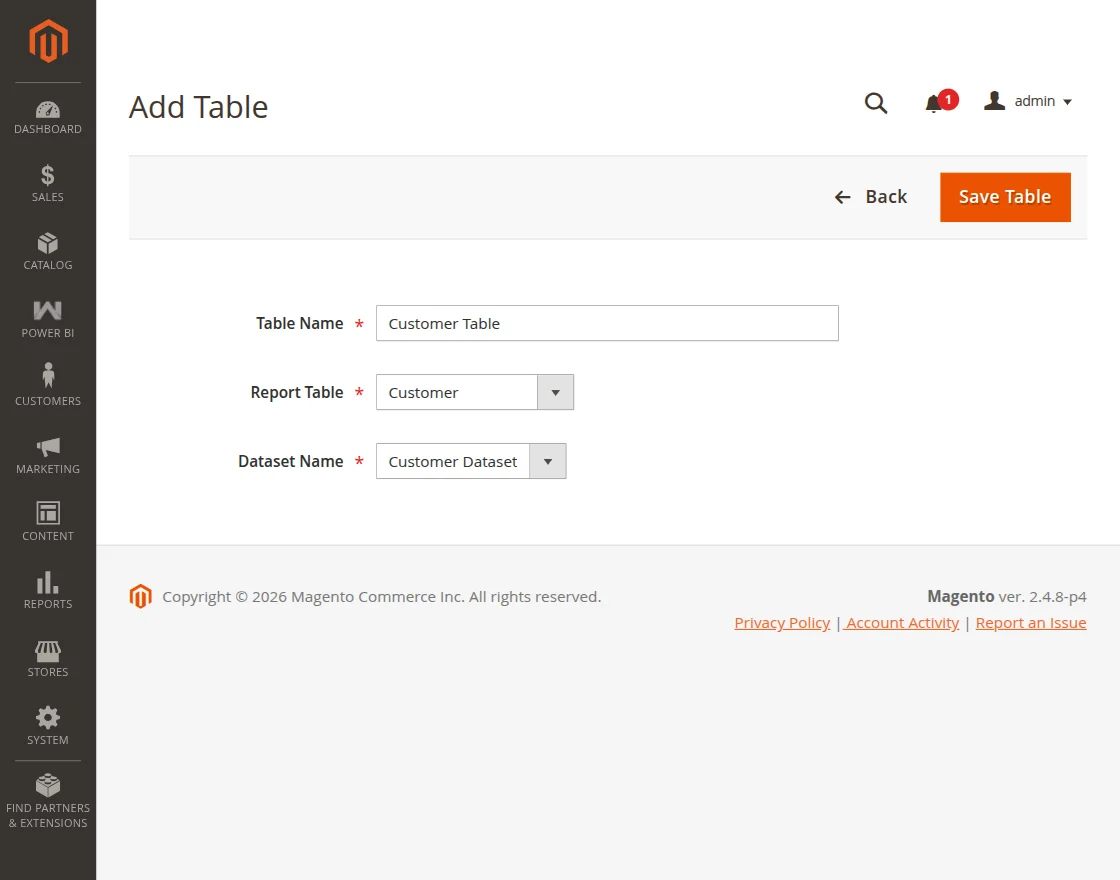
Here, the admin will –
- Add the name for the table.
- Choose the report table.
- Choose the respective dataset for this table.
Lastly, save the table by tapping the Save Table button.
After saving the table, you can see the respective table in the listing.
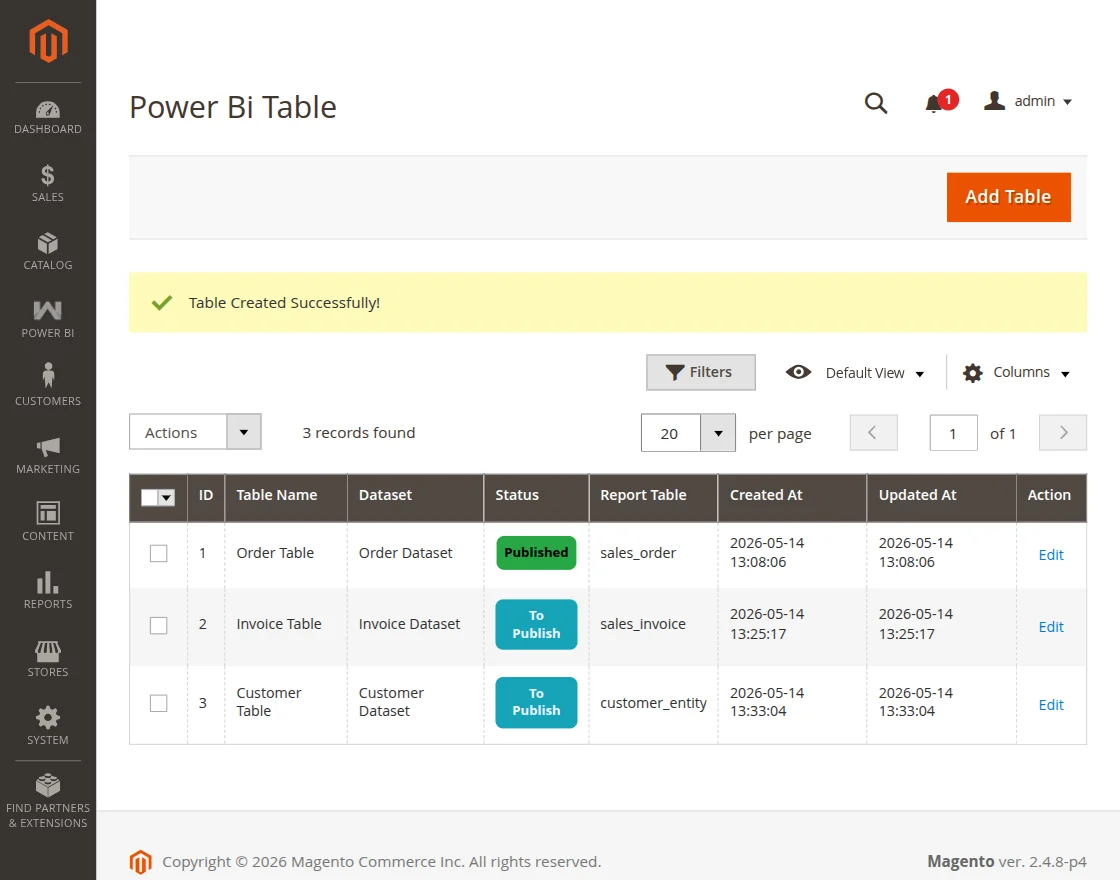
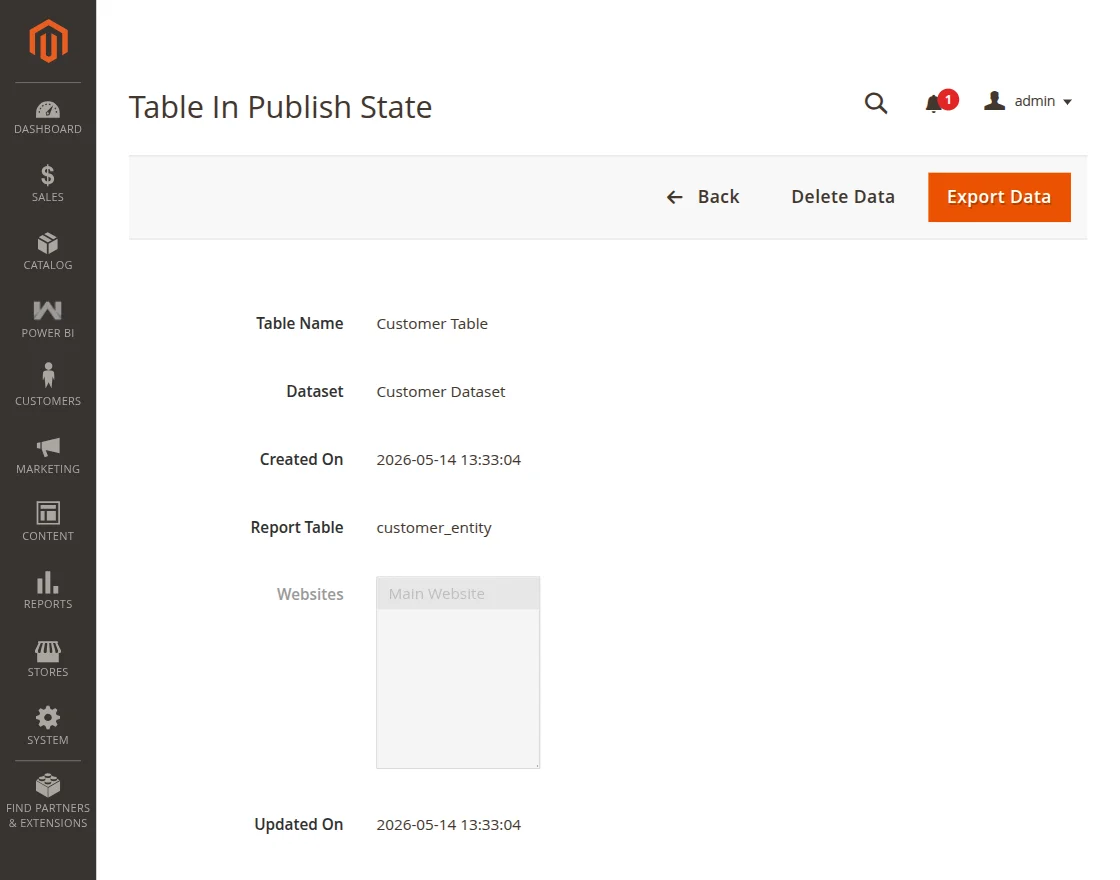
Note: After creating the table in the above step, you have to navigate to the dataset section and publish the dataset.
After this step, when you come back to this section you can see the table being published.
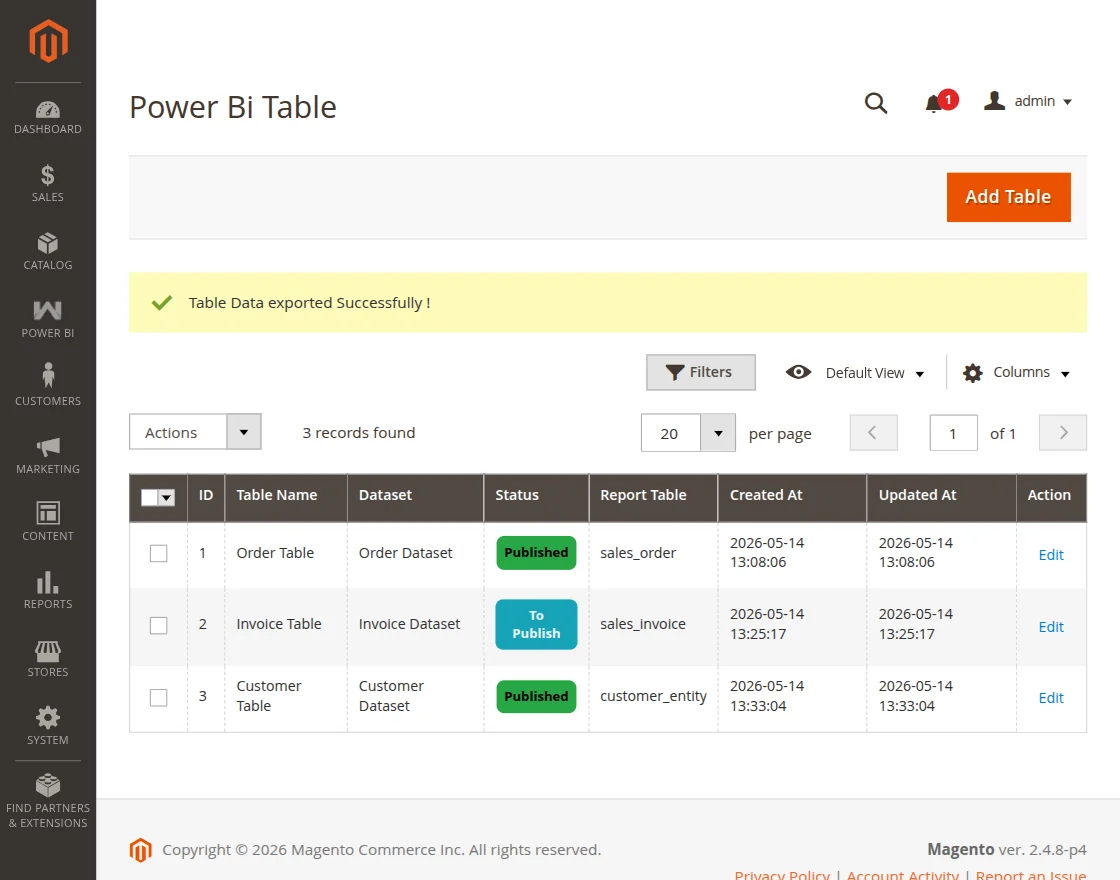
Thereafter, the admin will export the table data to Power BI. For the same, edit the respective table and tap the export button on the top right-hand corner.
After that, you can see a success message for the same.
Query Builder
Under this section, the admin can build custom data extraction rules without writing any code. The admin can create, edit, or delete query profiles as required.
To add a new query profile, navigate to Power BI → Power BI Connector Management → Query Builder and that brings up the below section.
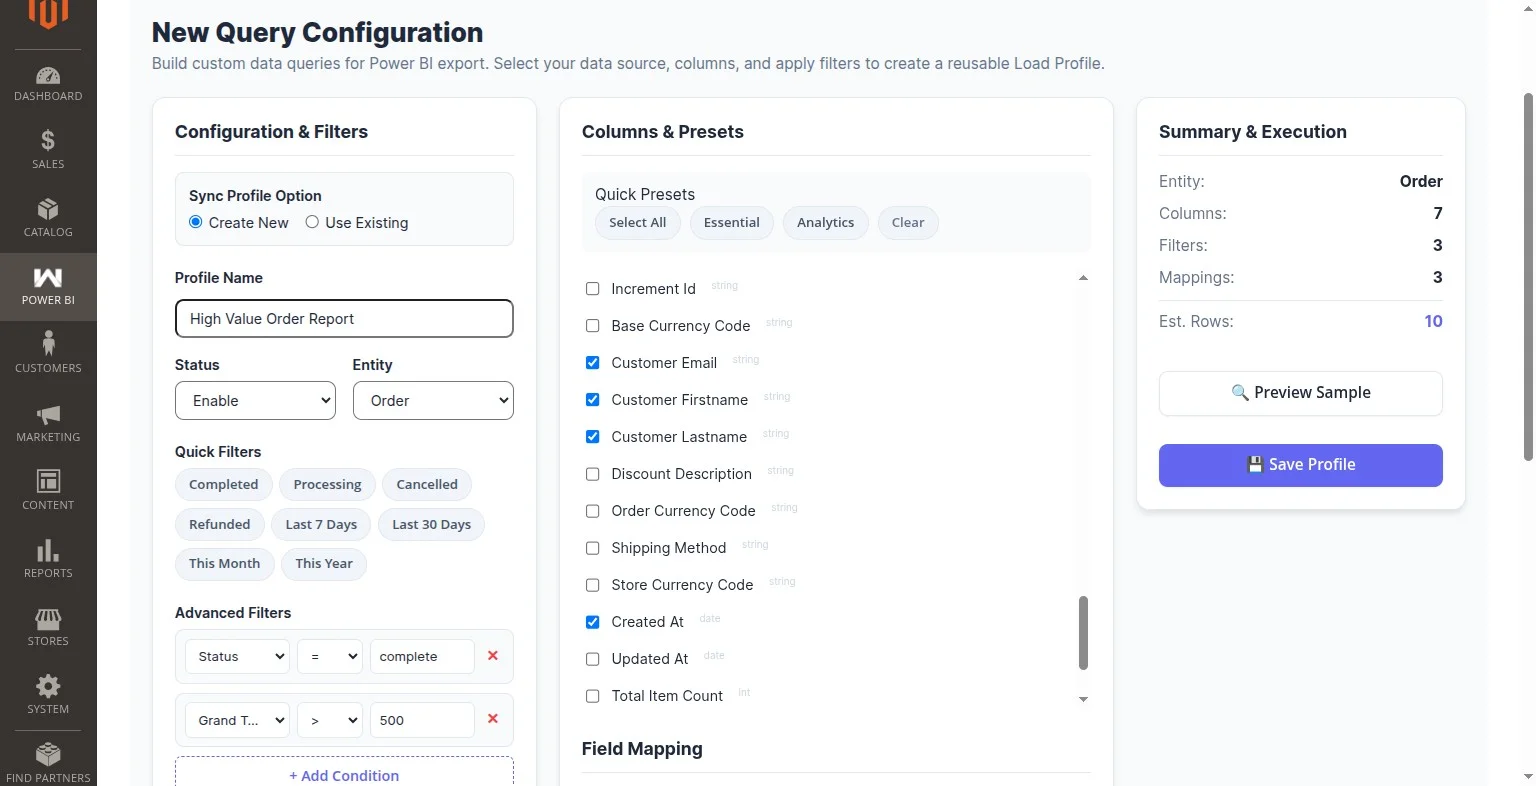
The Query Builder is divided into three panels:
Panel 1 — Configuration & Filters:
Here, the admin will —
- Choose Sync Profile Option:
Create New : Creates a brand new query profile with a fresh configuration.
Use Existing: Links to an already saved Load Profile to reuse an existing data extraction rule. - Choose the Sorting attribute and direction.
- Enter a Profile Name to identify the query.
- Set the Status as Enabled or Disabled.
- Select the Entity as the data source.
- Add Filter Conditions to narrow down the data using operators such as Equals, Not Equals, Greater Than, Less Than, Contains, or Null checks.
- Select a Date Preset (Last 7 Days, Last 30 Days, Current Month) or enter a custom date range.
Panel 2 — Columns & Presets:
Here, the admin will —
- Use Quick Presets to quickly select columns:
- Individually check or uncheck columns from the full list of available entity fields (e.g. Grand Total, Customer Email, Created At, Shipping Method, etc.).
- Use Field Mapping via the + Add Mapping button to rename any Magento attribute to a custom name for Power BI compatibility (e.g. rename
grand_totaltoTotalRevenue).
Panel 3 — Summary & Execution:
Here, the admin will —
- View a live summary of the selected Entity, total Columns, active Filters, and Mappings count.
- Check the Estimated Rows count to know the size of the data payload before pushing.
- Click Preview Sample to verify the first 10 rows of data before saving.
- Click Save Profile to save the query profile.
After saving, the admin will be redirected to the Load Profiles grid where the profile can be linked to a Workspace, Dataset, and Table. Saving at that point will automatically publish the dataset to Power BI.
To manually push data, click the Run button on the respective profile row from the grid.
After a successful data push, a success message will be displayed.
Access your Power BI Console:
Now, navigate to this link to access your Power BI console.
You can log in using your Microsoft Outlook account credentials.

After login, you can see your Power BI dashboard as per the snapshot below.

Now, from the side panel select the Workspace that you want to work on. Here, you can see all of the Workspaces imported from the Magento 2 store.
Select the one that you want to work on.

Let’s choose the Orders data that we had created at the Magento 2 store end. After selecting the same you can see the dataset that we had created at the Magento 2 store end, select the same.

After selecting the order dataset you can see the option to create a report and the tables data that can be used for creating the report.

Tap the Create a Report option and choose Start from the scratch option.

After that select the order table data that you want to use for the report and the particular graph for the same will be generated as per your selections.

Now, save the report by choosing the option.

After tapping the Save button, you need to give a name for the report and choose the Workspace for the same. After that, tap the Save button to save the report for the orders.

In a similar way, we can proceed with the Invoices Workspace and save the report for the same.

In a similar way, you can save the dashboards for the various workspaces as well.
Reports
After all the above sections have been configured, the admin will first navigate to the Workspace section and import the reports for the various workspaces created.

Choose a workspace and edit it.

Now, tap the import report option and the report will get imported

Now, under the Reports section, you can see the Power BI reports.

To open a Power BI report, tap the Report Web View link for the respective report. Below find the order report.

Invoice Report: In a similar way, go to the invoice workspace and import the report. Then come to the reports section to find the same.

Tap the Report Web View link and that brings up the report for the same at the Magento end.

Dashboard
For the dashboard view for the workspaces that you have created, you need to create the dashboards in the first place.
Navigate to your Power BI account, and select a workspace that you have created at the Magento 2 end. After that, tap on the new option and choose dashboard.

Then give a name to the dashboard and save it.

Now, go to the Magento 2 backend and navigate to the Workspace section. Select the workspace for which you have generated the dashboard and tap the Import Dashboard option.
After, that come down to the Dashboard section and you will find the option to view the dashboards for your created workspaces.

Tapping the Dashboard Web View link will display the dashboard in Power BI for the respective workspace.

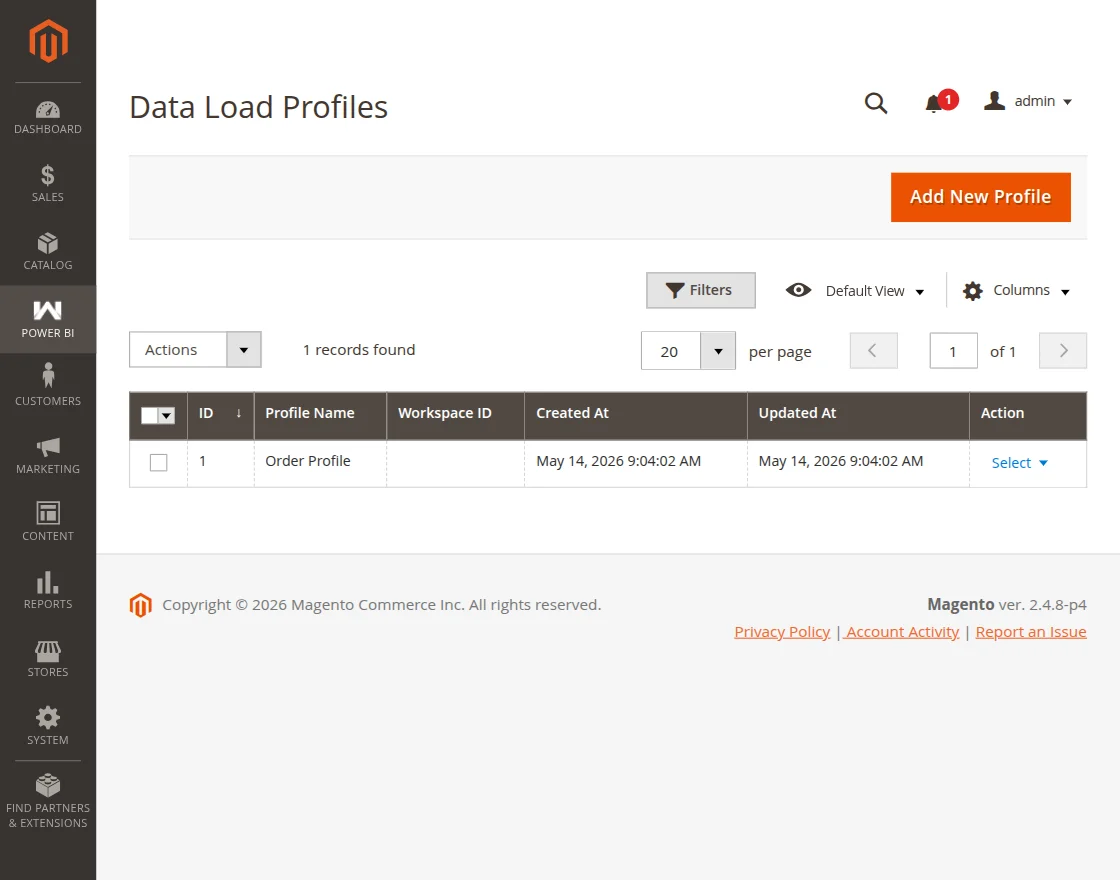
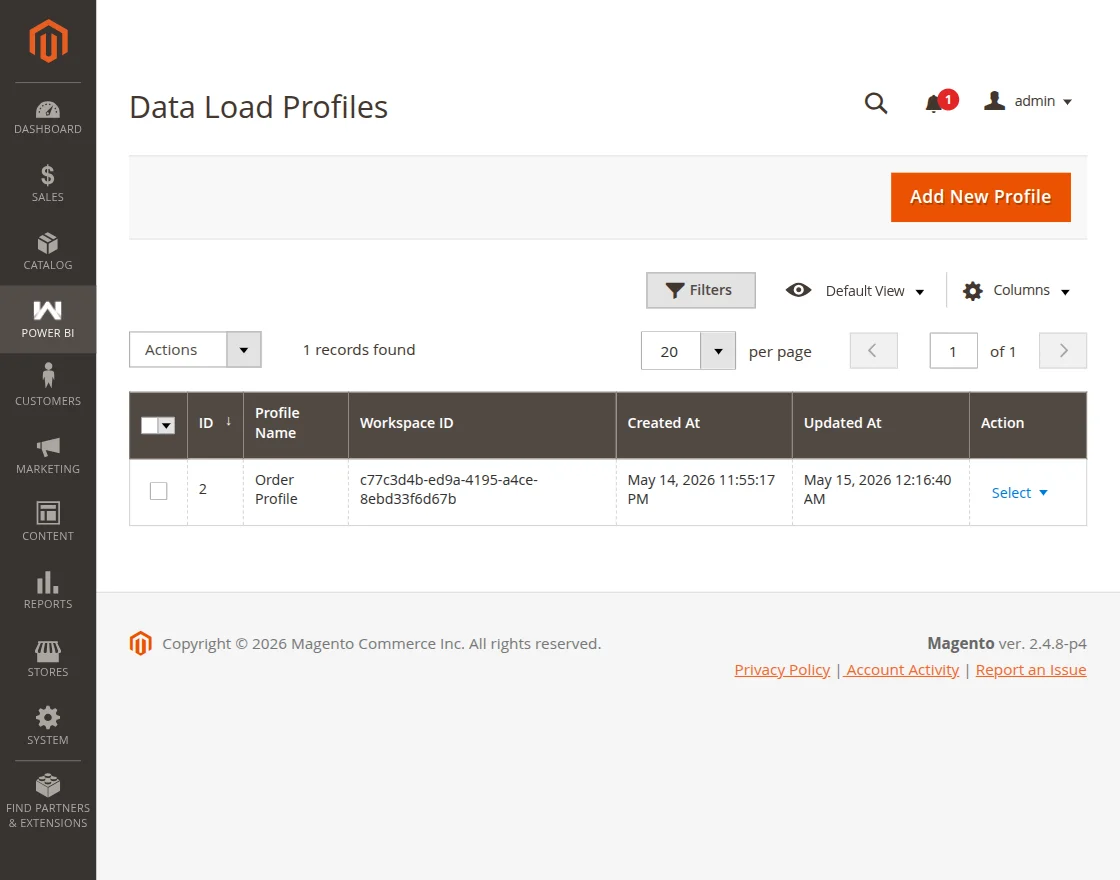
Load Profiles
Under this section, the admin will find all of the created Load Profiles. The admin can add, edit, delete, or run a load profile as required.
To add a new Load Profile, click the Add New Profile button and that brings up the below section.
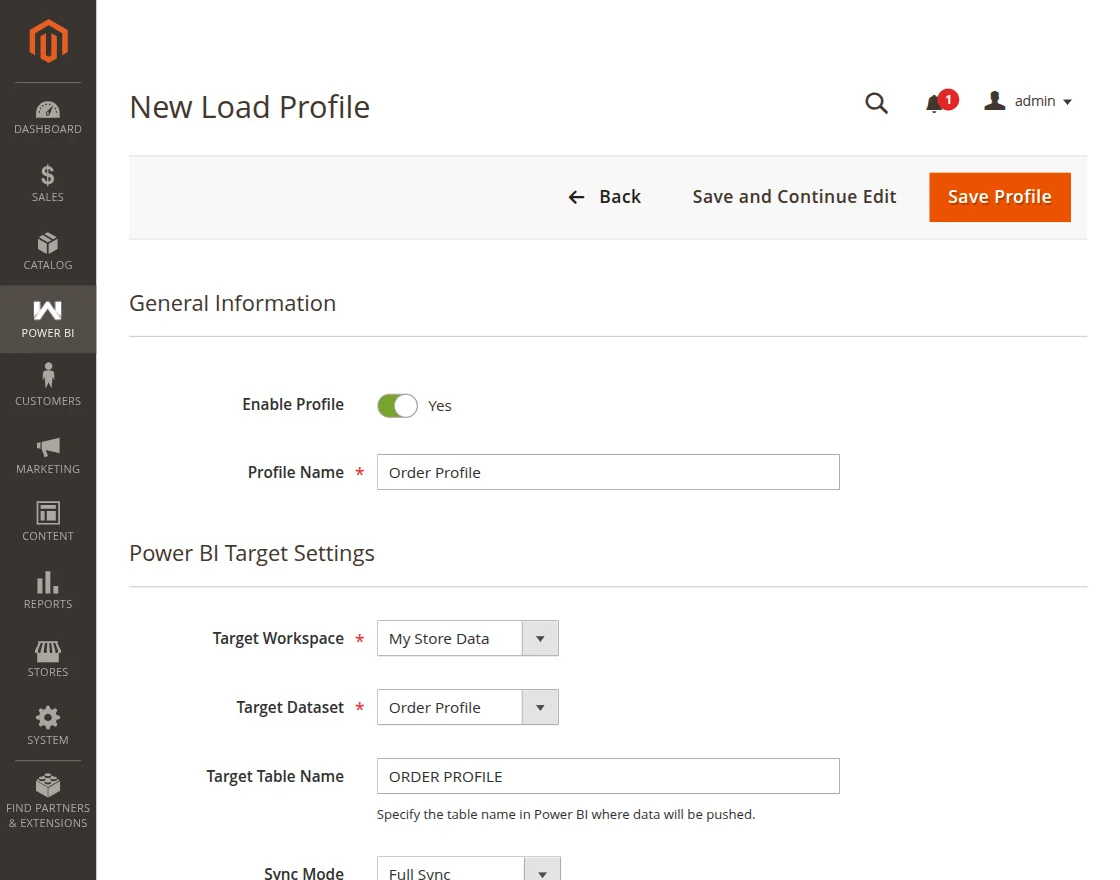
Here, the admin will –
- Select the Power BI workspace.
- Select the target dataset.
- Choose the target table name inside the dataset where the data rows will be pushed.
- Select the sync mode as Full Sync or Incremental Sync.
Lastly, click the Save Profile button to save the Load Profile.
After saving, the profile will appear in the Load Profiles grid and is ready to push data to Power BI.
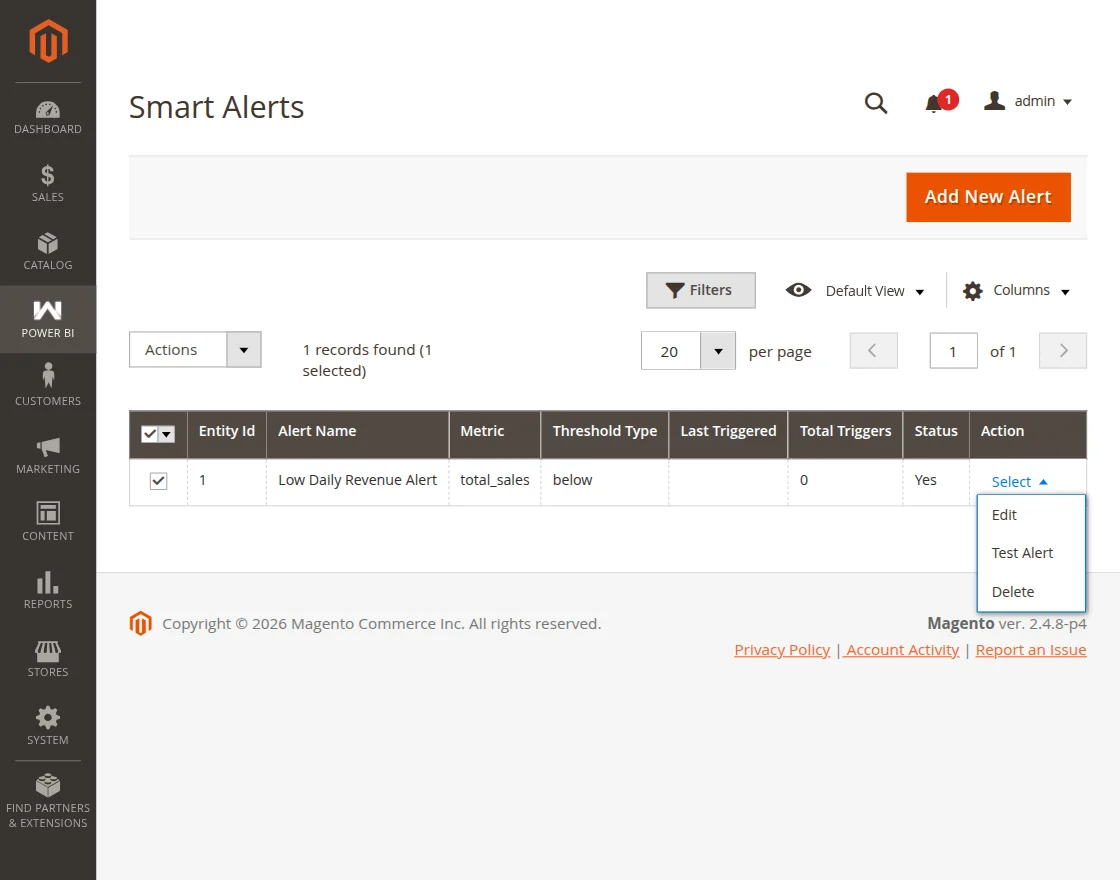
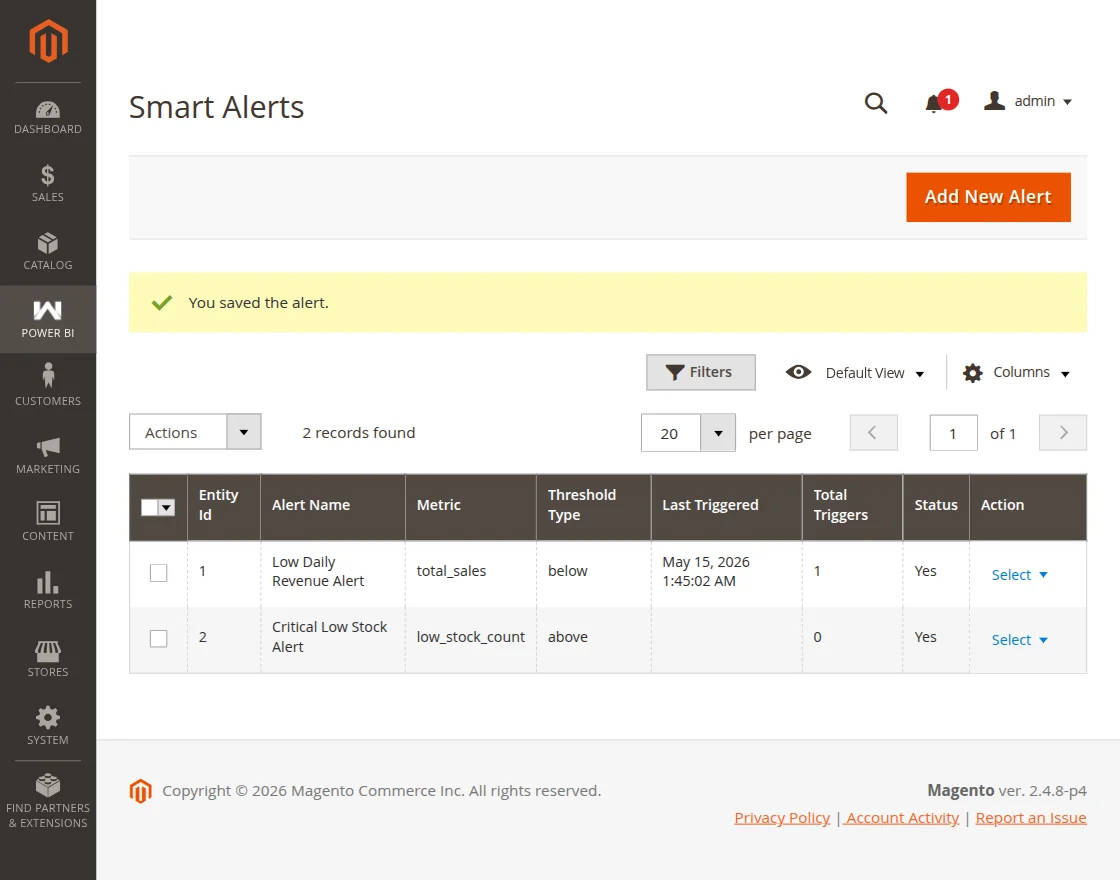
Smart Alerts
Smart Alerts allow the admin to set up automatic notifications that trigger when a key business metric crosses a defined threshold.
To access the Smart Alerts section, navigate to Power BI → Smart Alerts in the admin sidebar.
To add a new Smart Alert, click on the Add New Alert button and that brings up the below section.
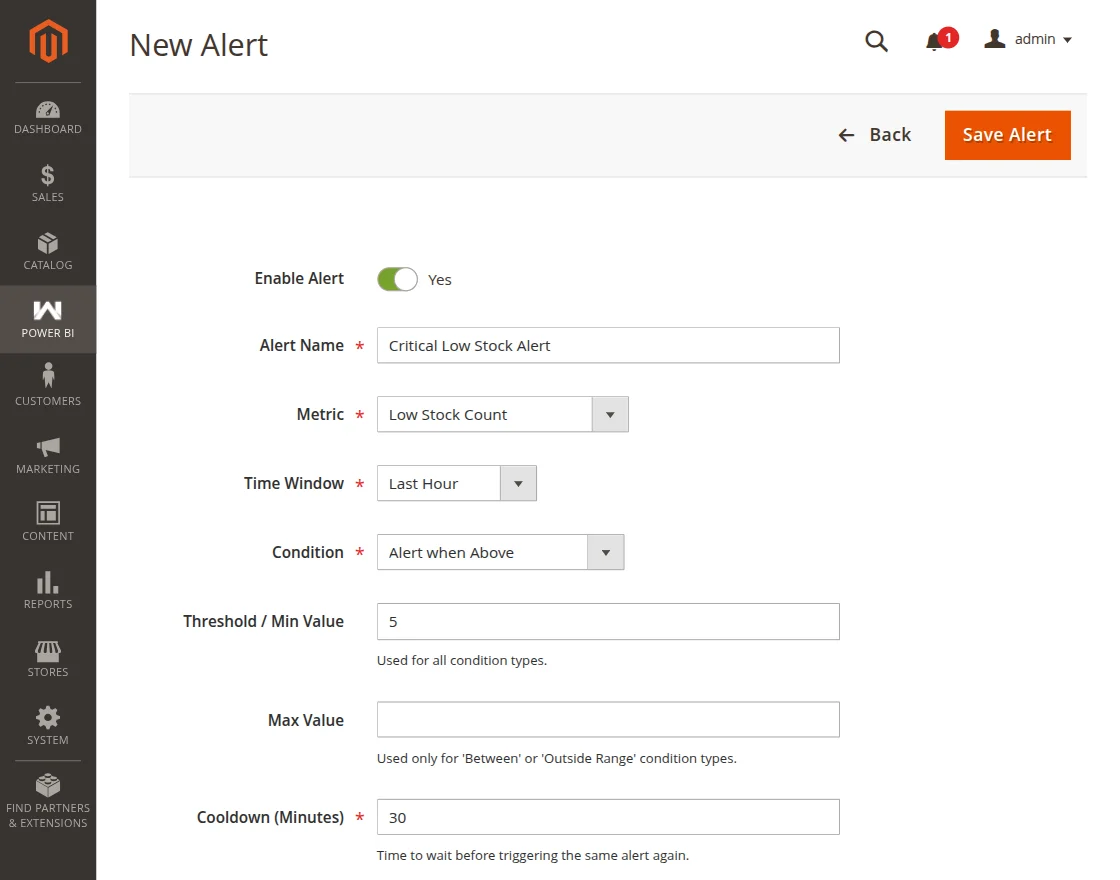
Here, the admin will –
- Toggle to enable or disable the alert.
- Enter a descriptive name to identify the alert.
- Select the metric to monitor.
- Select the time period to evaluate the metric.
- Select when the alert should trigger.
- Enter the threshold value that will trigger the alert.
- Enter the maximum value for the range. Used only for the Outside Range condition type.
- Enter the time in minutes to wait before the same alert is triggered again.
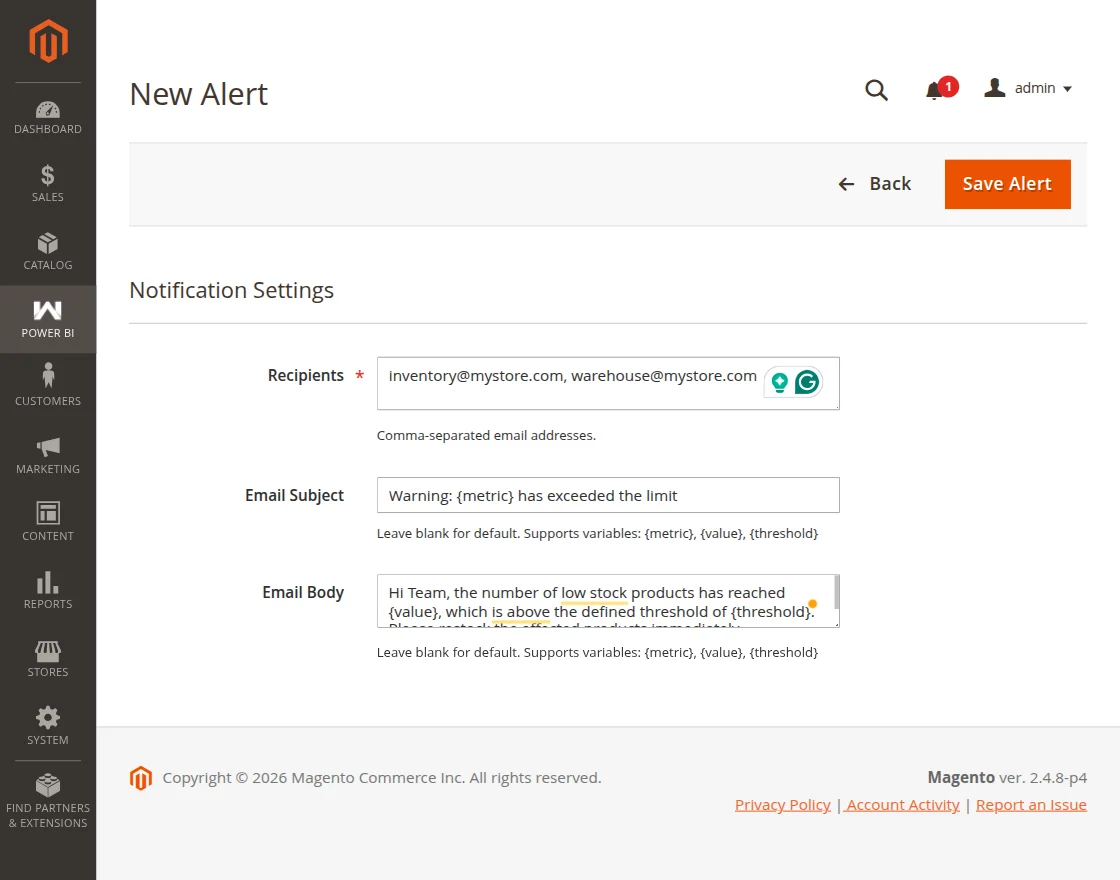
- Enter the email addresses to receive the alert notification. Multiple addresses can be entered separated by commas.
- Enter a custom email subject line.
- Enter a custom email body message.
Lastly, click the Save Alert button to save the Smart Alert. After that, you can see a success message for the same.
Alert History
Under this section, the admin can view a full log of all past Smart Alert evaluations.
To access the Alert History section, navigate to Power BI → Alert History in the admin sidebar.
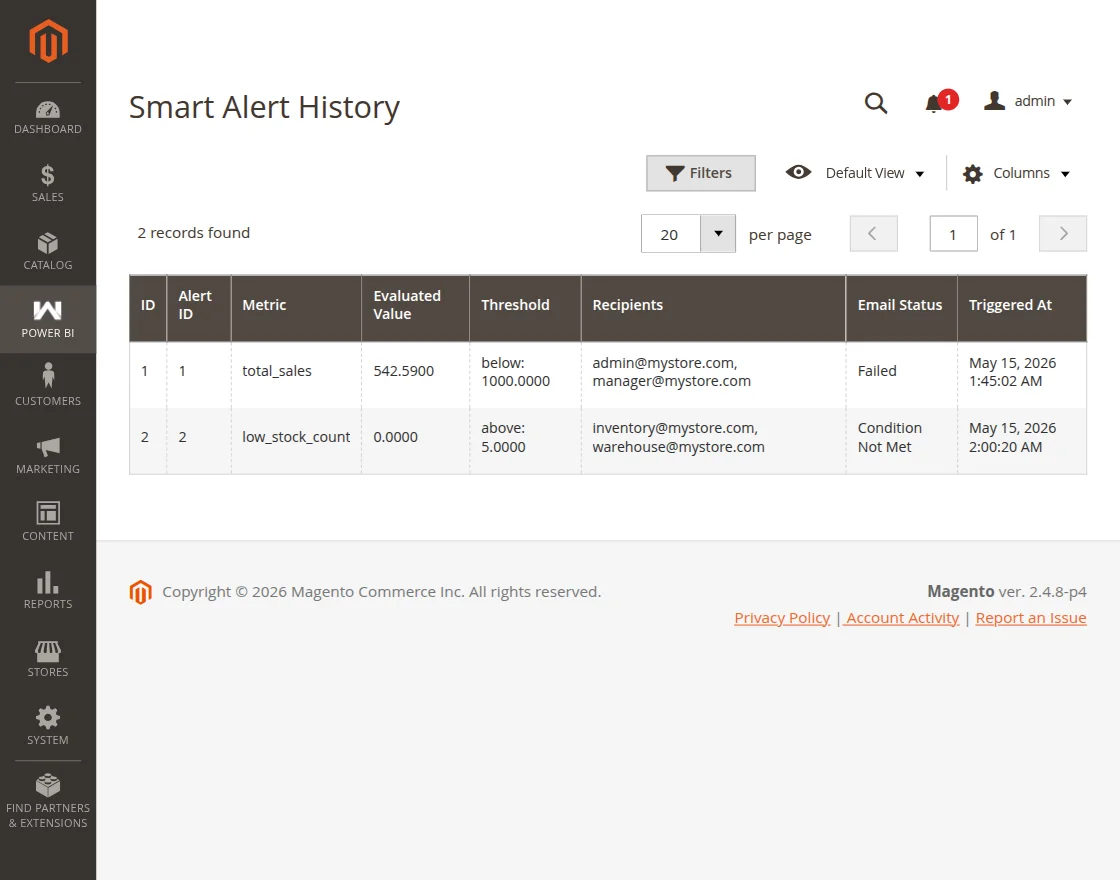
Here, the admin will find —
- The Metric that was monitored.
- The Evaluated Value of the metric at the time of evaluation.
- The Threshold condition and value defined in the alert.
- The Recipients who were notified.
- The Email Status — Sent, Failed, or Condition Not Met.
- The Triggered At timestamp showing when the alert was evaluated.
Sync Logs
Under this section, the admin can view a detailed log of every data sync attempt made by the module.
This helps the admin track which Load Profile syncs were successful and which ones failed, along with the reason for failure.
To access the Sync Logs section, navigate to Power BI → Sync Logs in the admin sidebar.
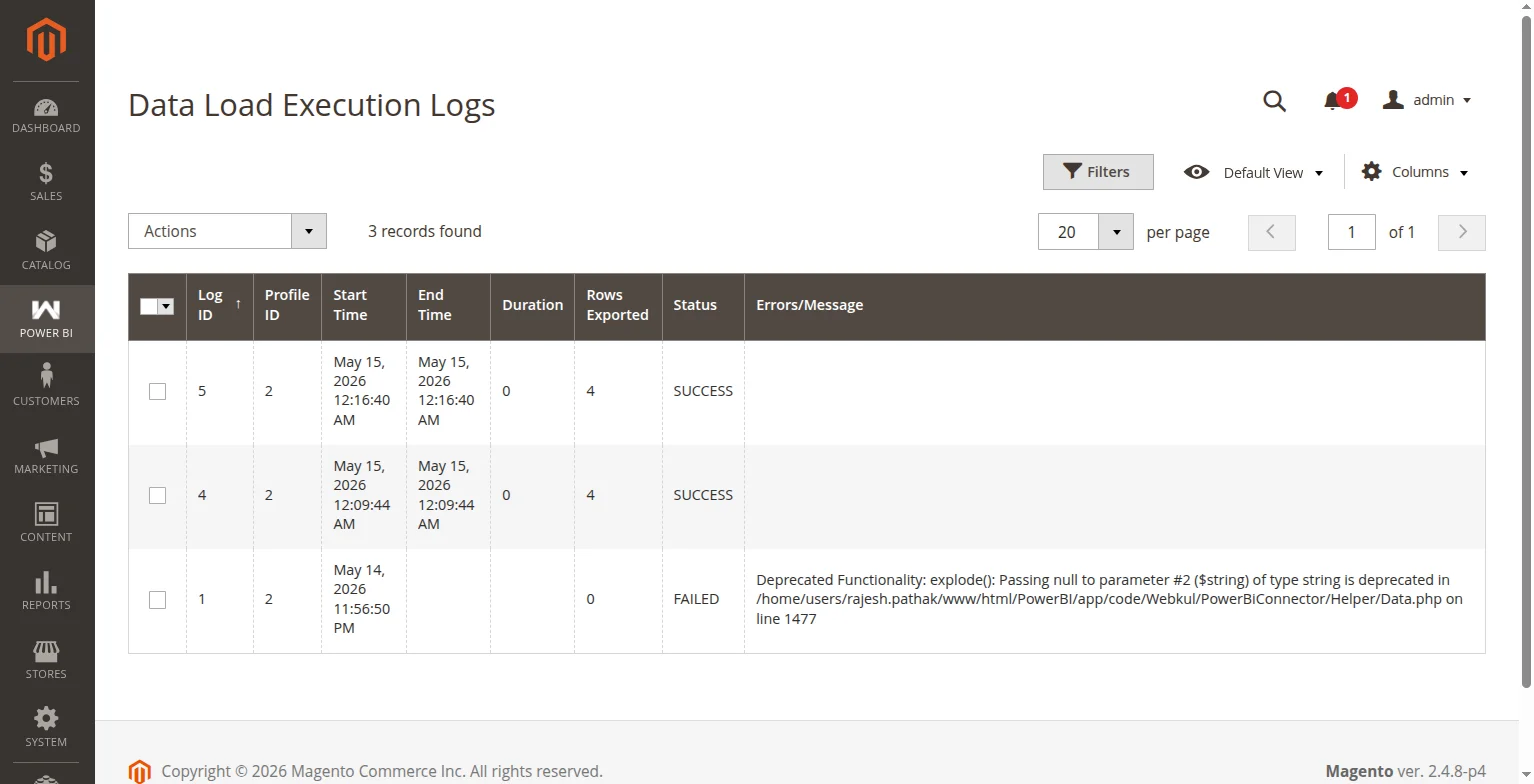
Here, the admin will find —
- The start and end time of Data Load Execution.
- The number of data rows that were pushed to Power BI.
- The result of the sync attempt.
- The error message if the sync failed, helping the admin identify and fix the issue.
Retry Queue
Under this section, the admin can view all failed sync jobs that are waiting to be retried.
When a data push fails due to a Power BI API timeout or throttle limit, the failed payload is automatically moved to the Retry Queue so no data is permanently lost.
To access the Retry Queue section, navigate to Power BI → Retry Queue in the admin sidebar.
Note: The Retry Queue is automatically managed by the module’s background cron. Entries are retried automatically at regular intervals. If an entry continues to fail after multiple attempts, it will be permanently archived in the failure log for review.
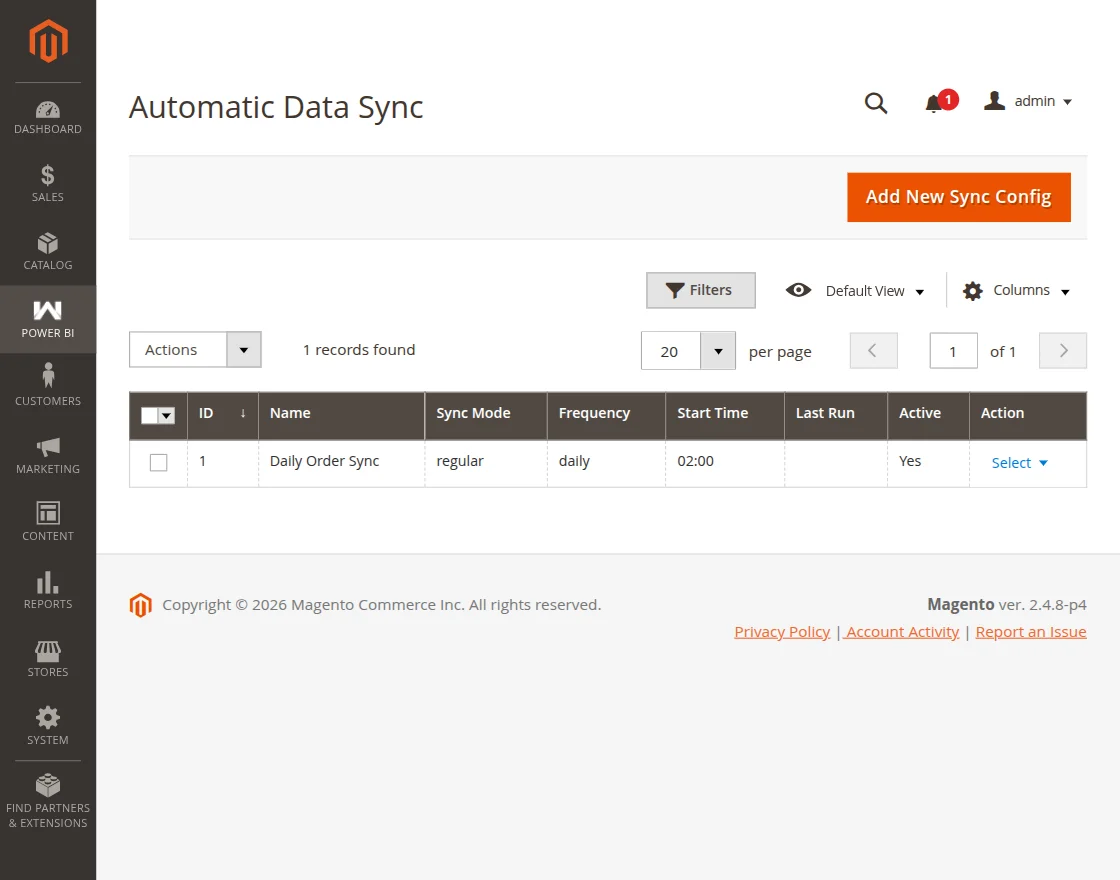
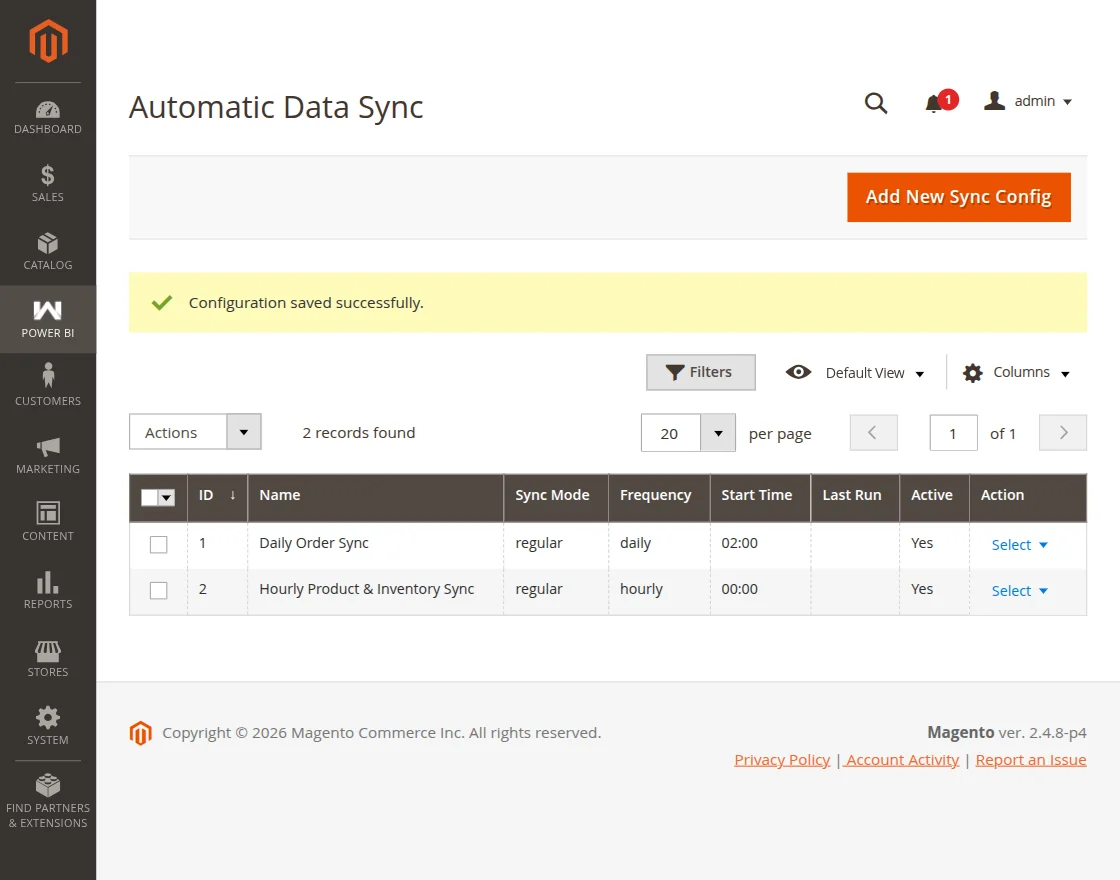
Automatic Data Sync
Under this section, the admin can set up automated schedules to push Magento store data to Power BI at regular intervals — without any manual effort.
To access the Automatic Data Sync section, navigate to Power BI → Automatic Data Sync in the admin sidebar.
To add a new Load Profile, click the Add New Profile button button and that brings up the below section.
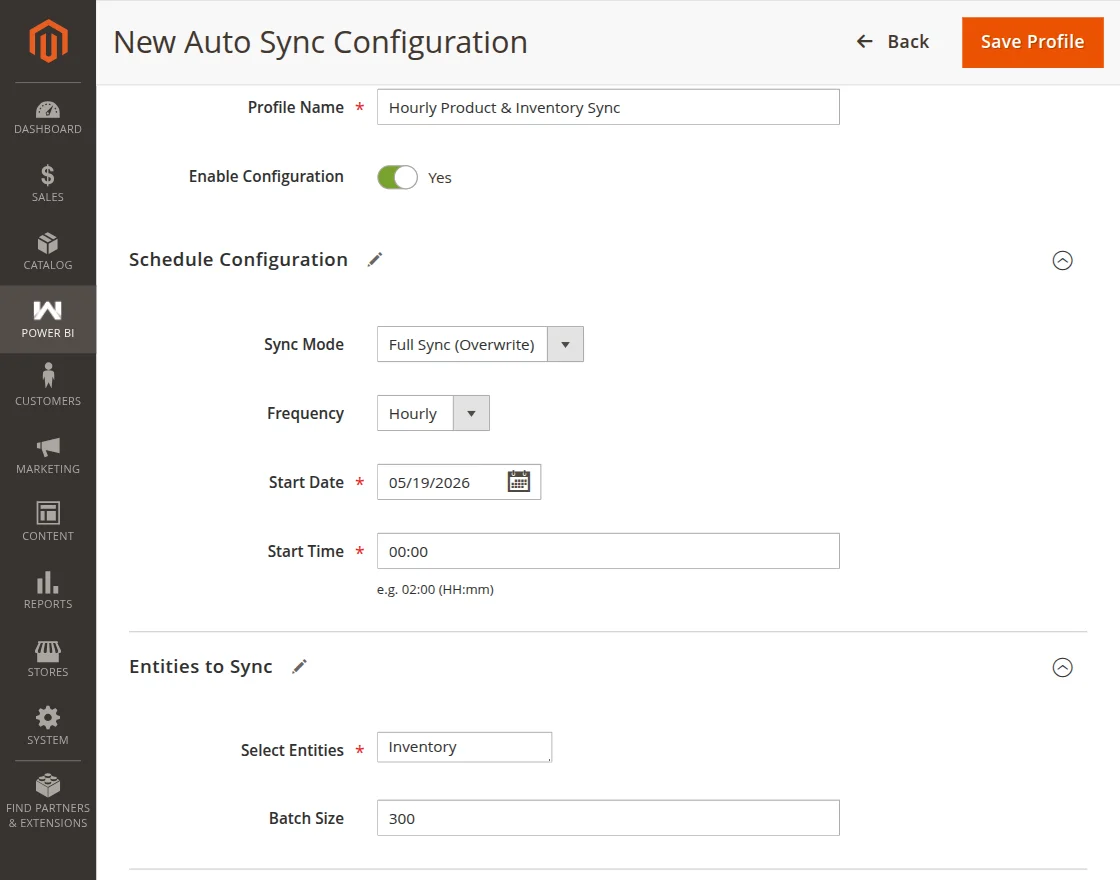
Here, the admin will –
- Enter a descriptive name to identify this sync configuration.
- Toggle to enable or disable this automated sync schedule.
- Select how often the sync should run — Hourly, Daily, or Weekly.
- Select the sync mode as Full Sync or Incremental Sync.
- Select the start date and time.
- Select one or more Magento data entities to include in the sync.
- Enter the number of records to push per API request (recommended: 100–500 rows).
Lastly, click the Save Profile button to save the Configuration. After that, you can see a success message for the same.
Support
That is all about the Magento 2 Power BI Integration extension. If you have any queries regarding the plugin, please contact us at Webkul Support System.
If you’re looking to create a custom e-commerce website, it’s a great idea to hire Magento developers who can help you build a powerful and scalable online store.
You can also check our complete Magento 2 extensions.
Current Product Version - 5.0.3
Supported Framework Version - Magento 2.0.x, 2.1.x, 2.2.x,2.3.x, 2.4.x

Be the first to comment.