Multivendor Marketplace for Shopify Analytics: New Feature
Introducing Analytics in Multivendor Marketplace for Shopify
Yes, we have added a brand-new Analytics section to our Multivendor Marketplace app for Shopify.
You can now see how your catalogue and your orders are doing, for any period you choose, without exporting a single CSV.
You will find Analytics in the left navigation menu of the Multivendor Marketplace app. It has two sub-sections:
- Product Analytics: how the catalogue is growing, what is selling and what needs attention.
- Order Analytics: how many orders came in, what they were worth and where they ended up.

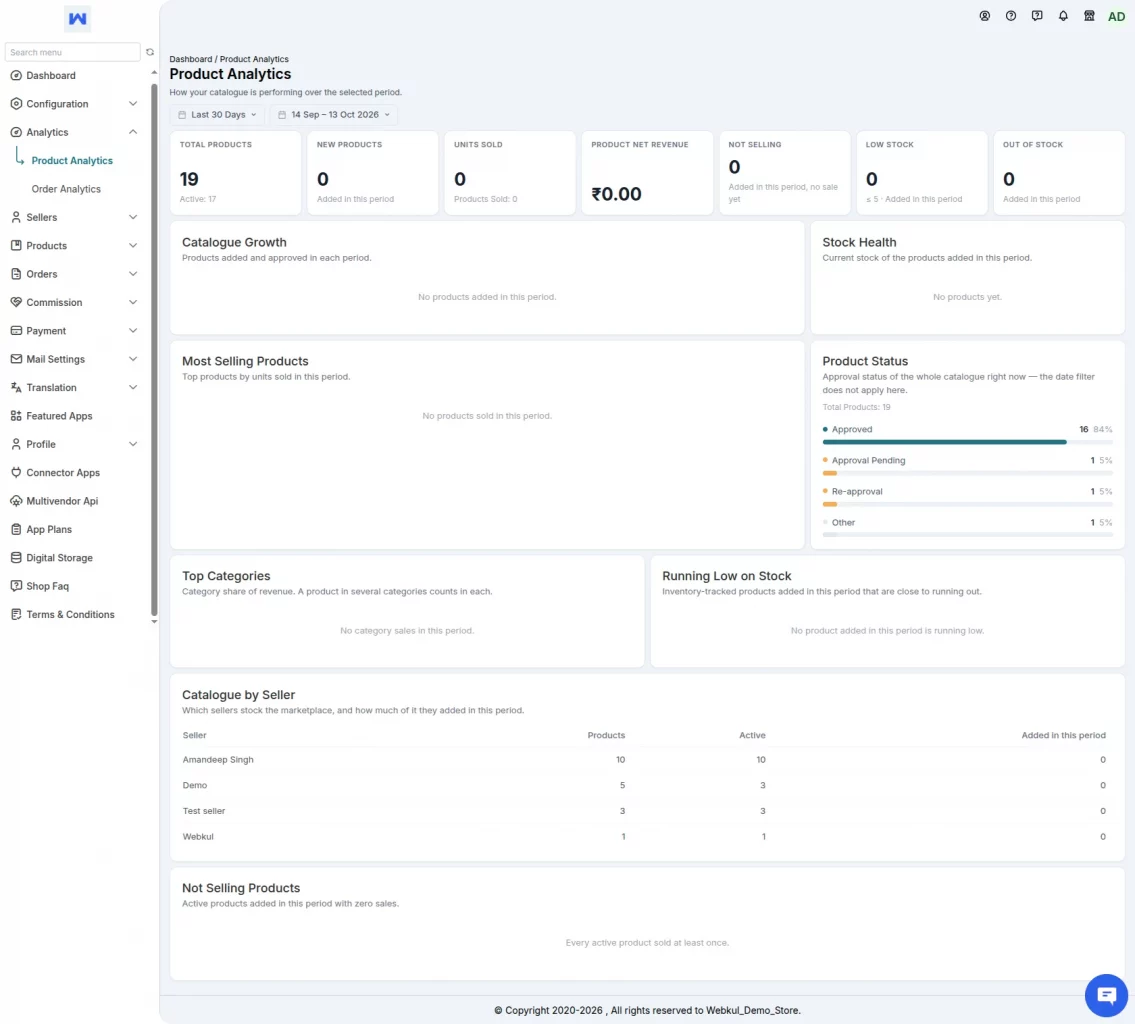

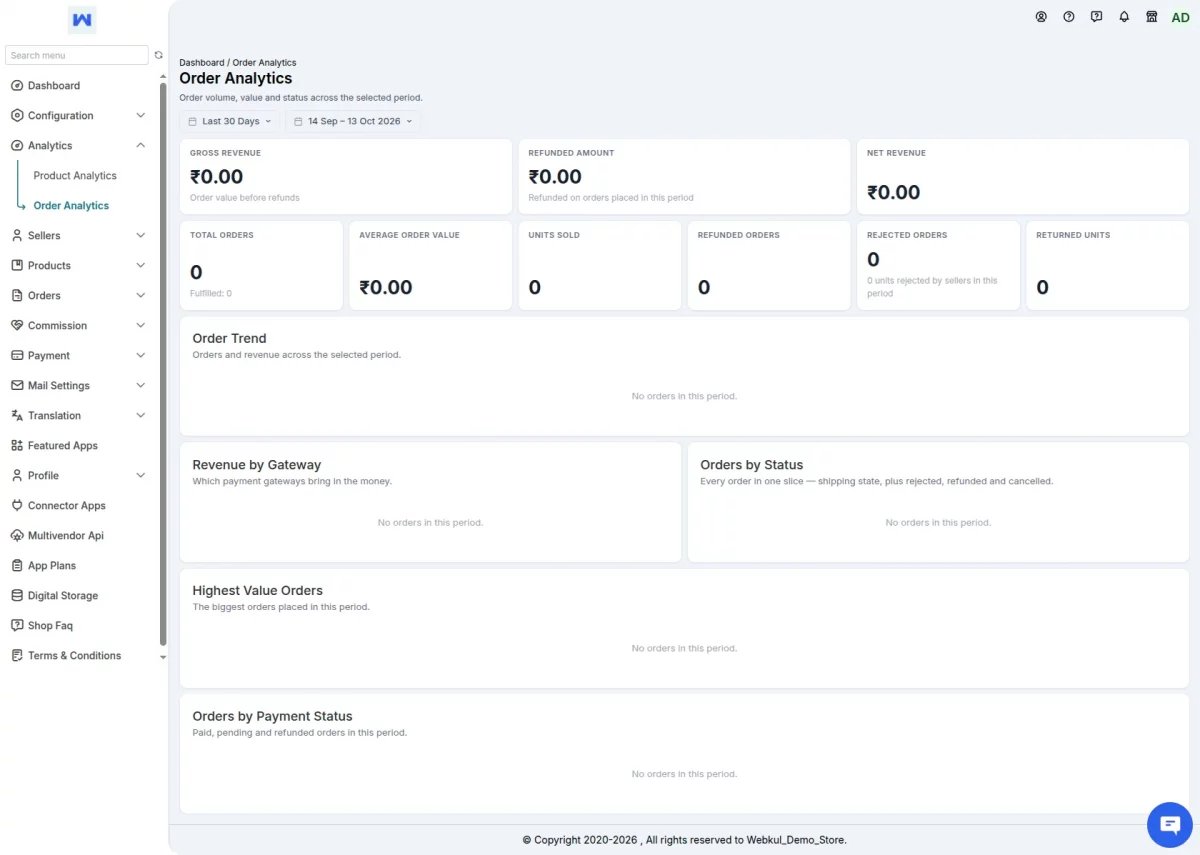
Admin End: Multivendor Marketplace >> Analytics >> Product Analytics / Order Analytics
The same section is available in the Seller Portal too, so every seller can track the performance of their own store.

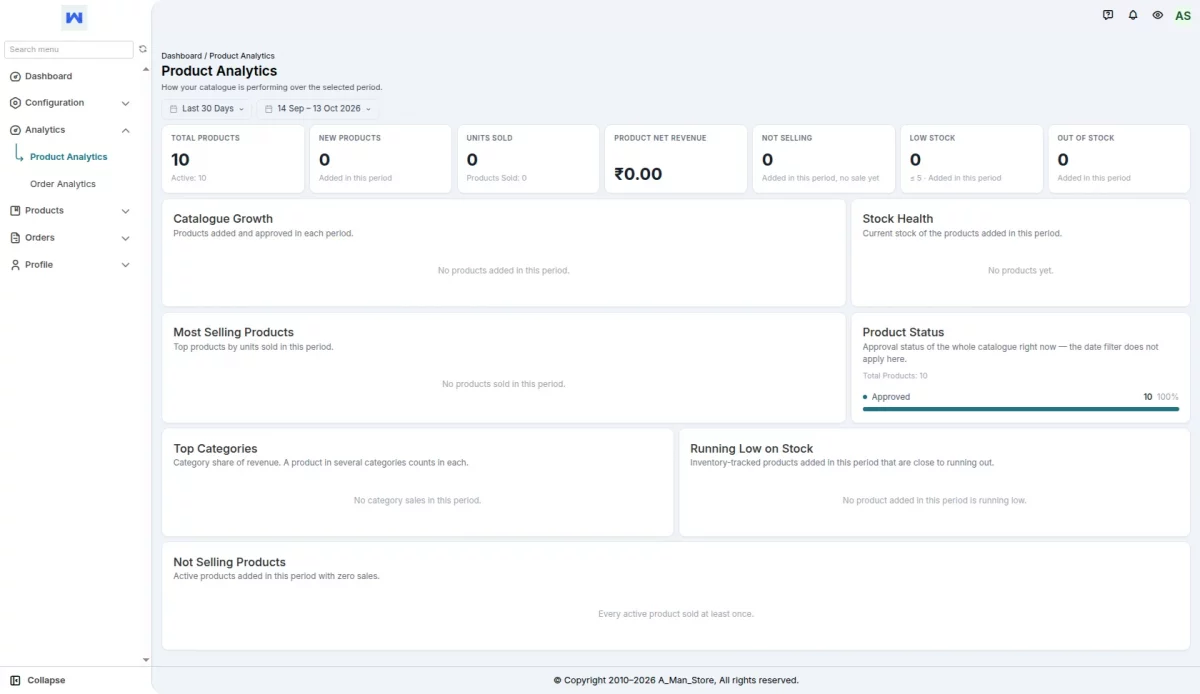
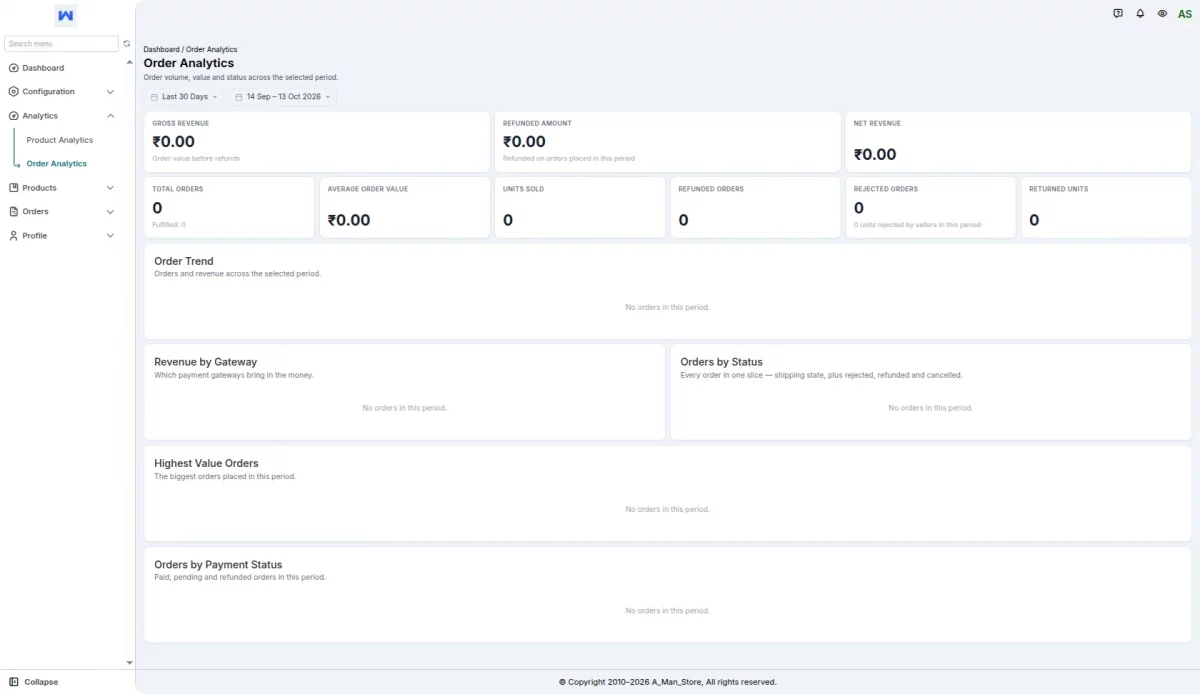
Seller End: Seller Portal >> Analytics >> Product Analytics / Order Analytics
Pick Your Period with the Date Range Filter
Both pages share one date filter, placed right under the page title. Every number, chart and list on the page reflects the period you select.
The filter shows two chips: the name of the selected preset and the exact dates it covers, for example, “1 Jan – 31 Mar 2026”. This way, users never mistake a number for an all-time total.
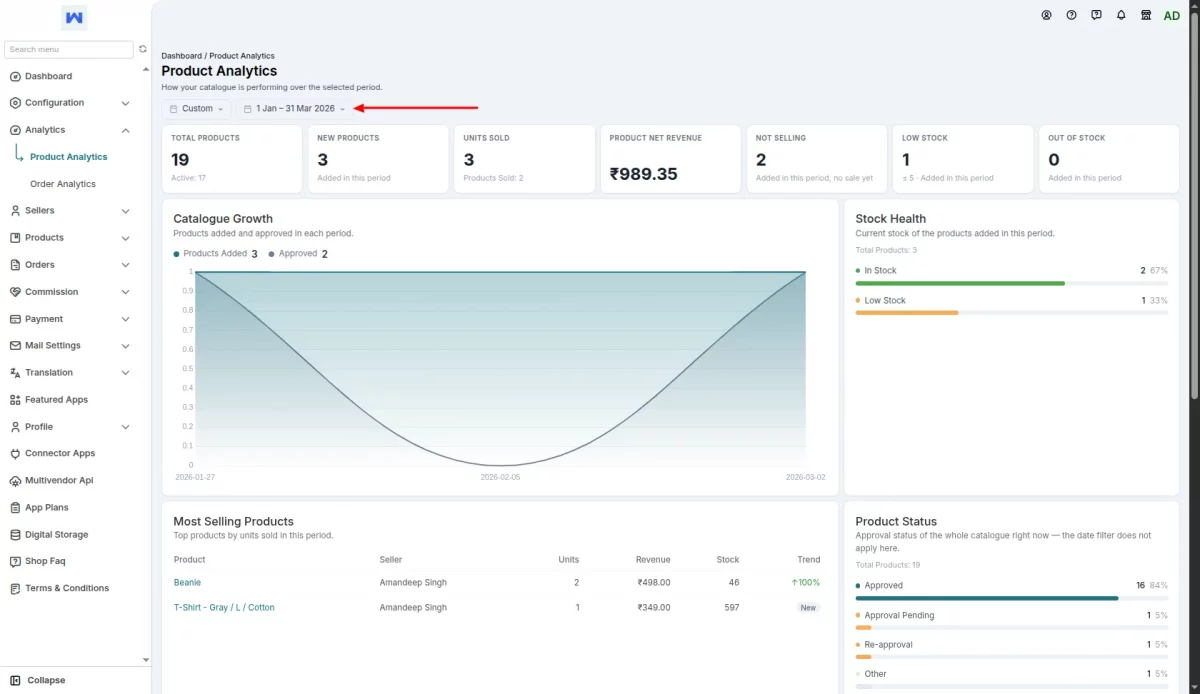
How it works:
- The page opens on Last 30 Days by default.
- Click a chip to open the picker. Choose a preset: Today, This Week, This Month, Last 30 Days, Last 90 Days, This Year, Last 12 Months or Custom.
- For a custom range, click a start and an end day on the calendar (two months side by side on desktop, one on mobile), or type the From and To dates.
- Press Apply to load the new range. Cancel, Escape, or a click outside the picker closes it without any change.
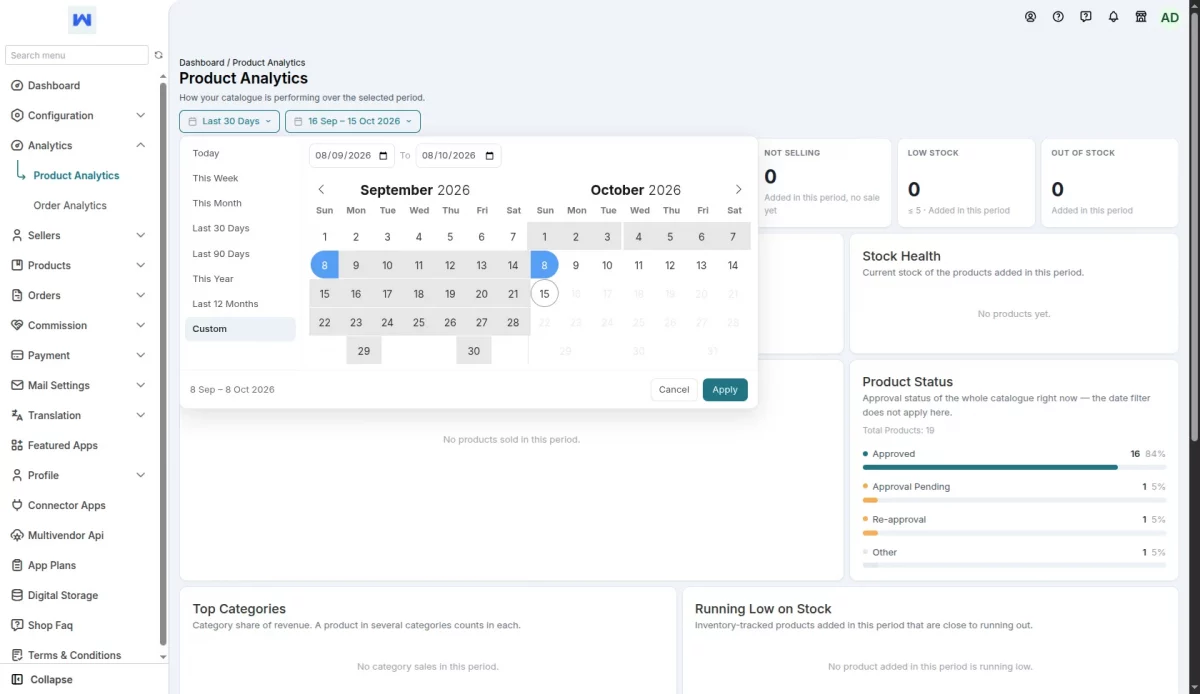
When you apply a new range, the page refreshes in place. The previous figures stay visible while the new ones load, so the page never goes blank.
Admin: Product Analytics
Product Analytics shows how your catalogue is growing, what is selling and what needs attention.
Navigation: Analytics >> Product Analytics
Summary Cards
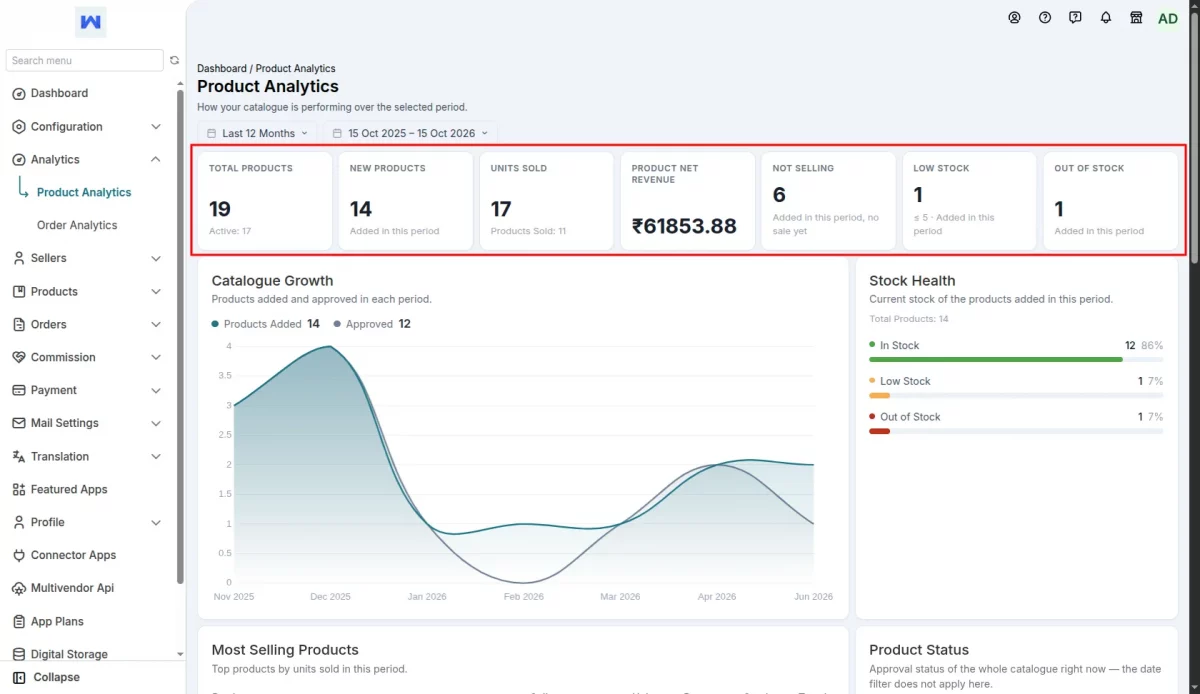
The page opens with a row of seven number cards:
- Total Products, with how many are active.
- New Products added in the period.
- Units Sold, with how many different products those came from.
- Product Net Revenue: the money earned from product sales in the period.
- Not Selling: products added in the period that have not sold yet.
- Low Stock: tracked products added in the period that are down to a handful of units. The card shows the threshold, 5 by default.
- Out of Stock: tracked products added in the period that have run out.
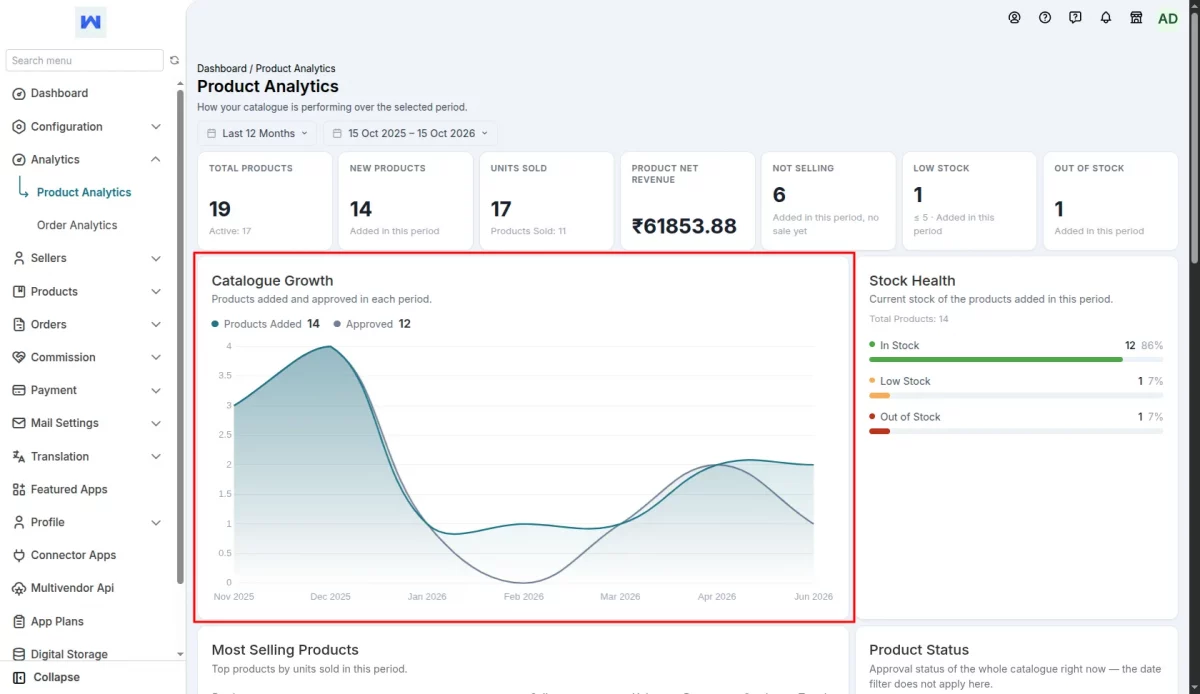
Catalogue Growth
A chart shows how many products were added and how many were approved, for each day of the period. It groups by hour when you select a single day and by month for longer ranges.
Now, you can see at a glance whether the catalogue is growing and whether approvals keep pace.
Stock Health
Four labelled bars show In Stock, Low Stock, Out of Stock and Not Tracked for products added in the period. It is a quick read on inventory risk.
Most Selling Products
A ranked list of your best sellers by units, with revenue, current stock and a trend arrow comparing to the previous period of the same length.
Admins also see which seller owns each product. Click a product name to open the product page.
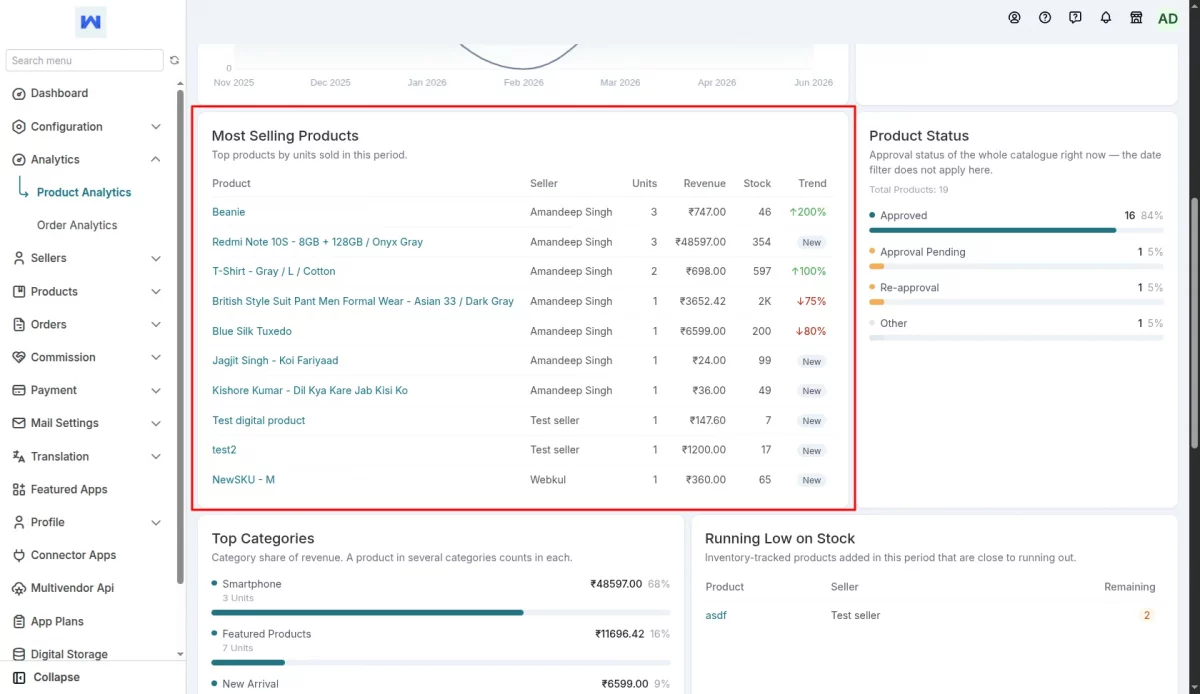
Product Status
Bars for Approved, Approval Pending, Re-approval, Disabled, Denied and Other.
Please note: Product Status is a snapshot of the whole catalogue right now. The date filter does not apply to this panel, and the panel says so.
Top Categories
A ranked list of categories by share of revenue, with units sold beside each. A product that sits in several categories counts in each of them.
Running Low on Stock
A list of products about to run out, with the remaining quantity highlighted, so you can restock in time.
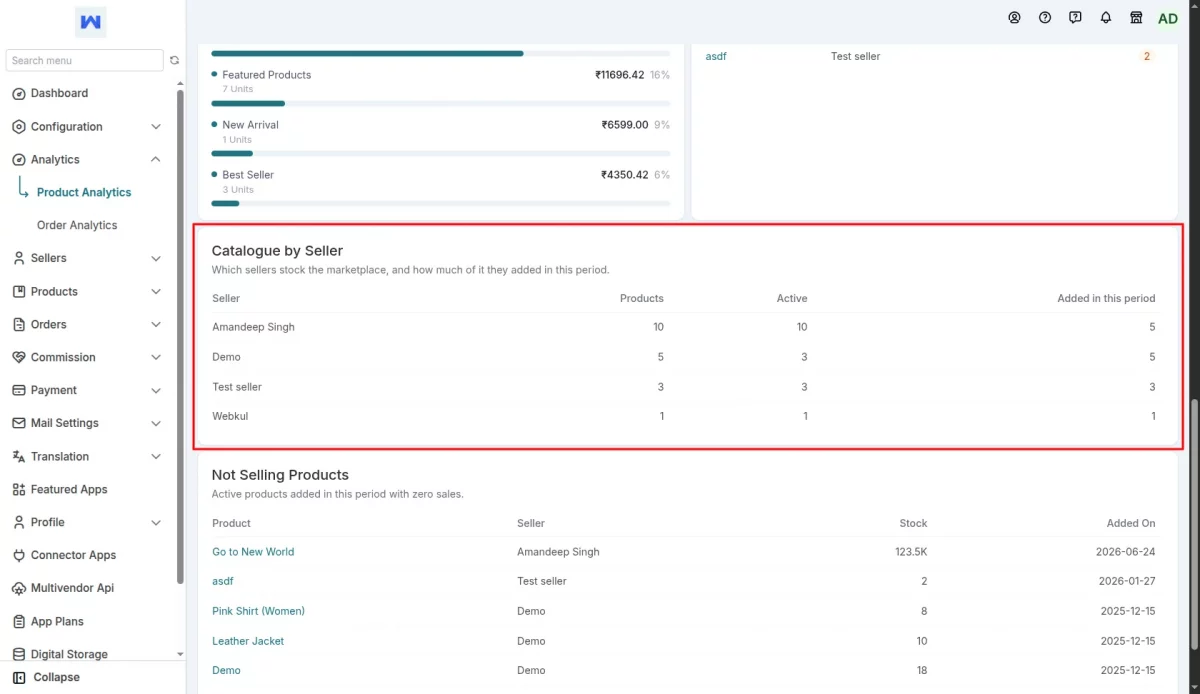
Catalogue by Seller (Admin Only)
This table shows which sellers stock the marketplace: total products, active products and how many each seller added in the period.
Not Selling Products
The products added in the period that have not sold yet, newest first. When the list is cut short, the subtitle tells you how many are shown out of the total.
When you change the date range, the seven cards all recalculate. Only Product Status stays the same.
If a panel has nothing to show, it says so in plain words, for example “No products added in this period” or “Every active product sold at least once.”
Admin: Order Analytics
Order Analytics shows how many orders came in, what they were worth and where they ended up.
Navigation: Analytics >> Order Analytics
Revenue Cards
Three cards show Gross Revenue (order value before refunds), Refunded Amount and Net Revenue. Gross minus refunds equals net, so the three always add up.
Net Revenue also shows how it moved against the previous period of the same length.
Order Cards
- Total Orders, with the number fulfilled and the change versus the previous period.
- Average Order Value, with its change.
- Units Sold.
- Refunded Orders.
- Rejected Orders, with how many units sellers rejected.
- Returned Units.
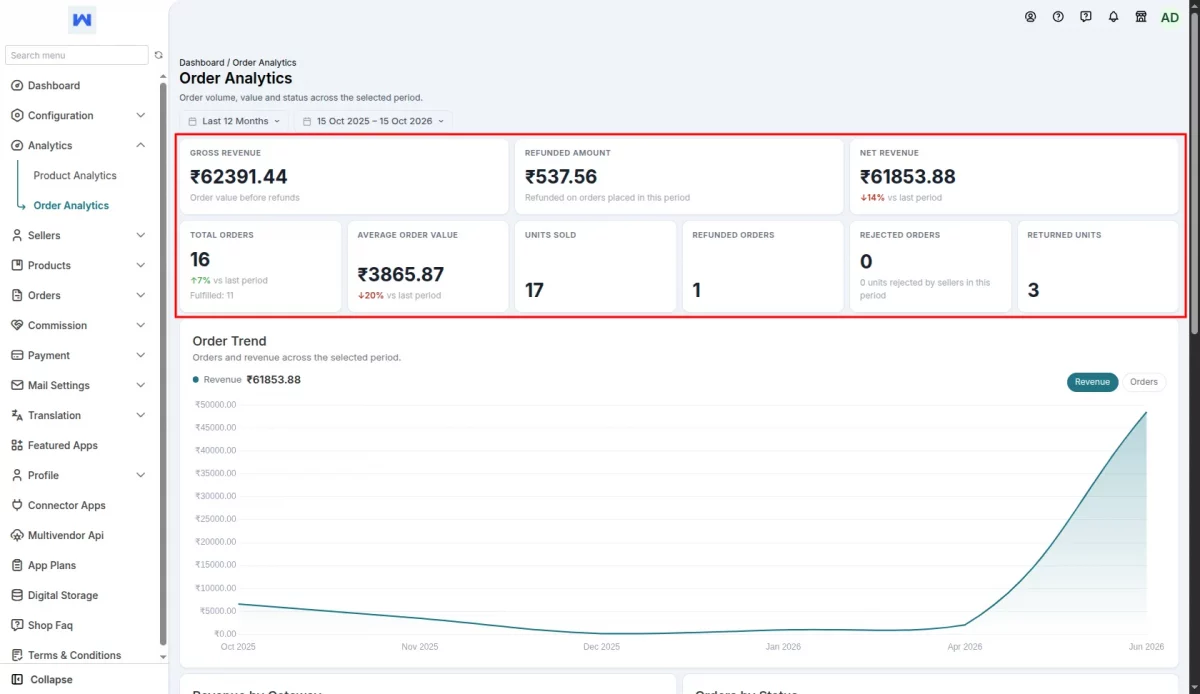
Change indicators appear as a green up arrow, a red down arrow or a grey flat arrow.
Please Note: If there is nothing to compare against, for example, in a brand-new store, no change indicator is shown.
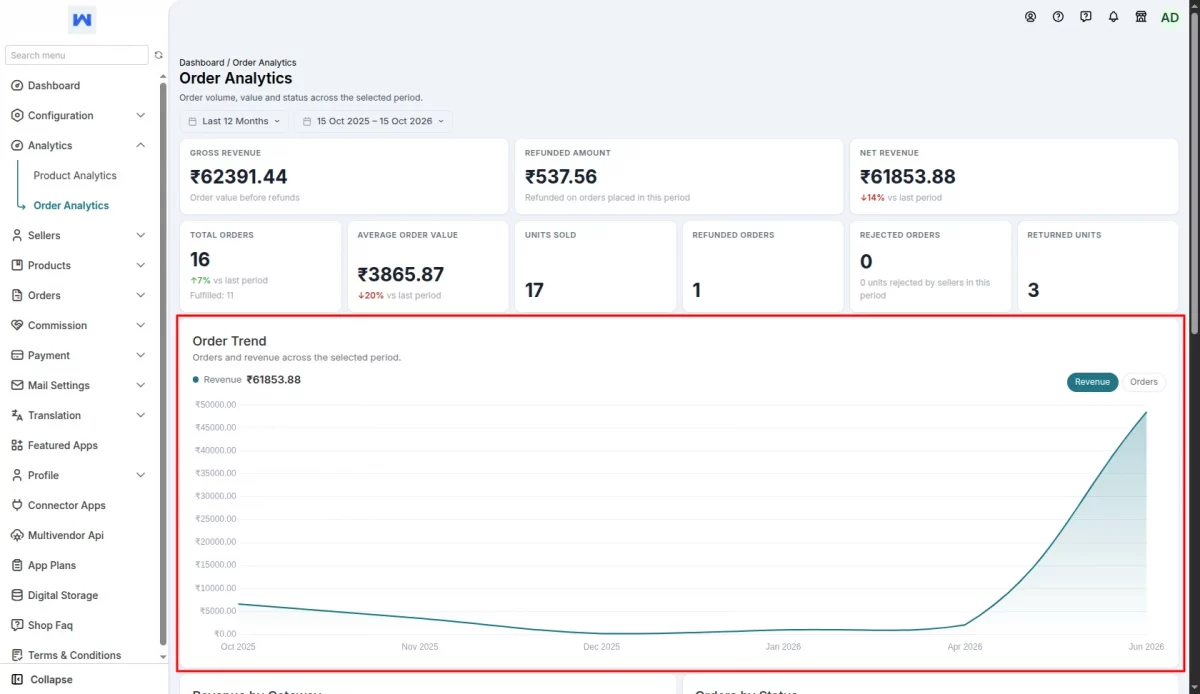
Order Trend
A large area chart shows your orders over the selected period. Two buttons switch it between Revenue and Orders, one measure at a time, so the chart stays easy to read.
It groups by hour for a single day, by day for ranges up to about four months, and by month beyond that.
Revenue by Gateway and Orders by Status
These two panels sit side by side:
- Revenue by Gateway: bars showing which payment gateways bring in the money, with the number of orders for each.
- Orders by Status: the total number of orders in the period, then bars where every order falls into exactly one status: Fulfilled, Delivered, Partially Fulfilled, Unfulfilled, Rejected, Partially Rejected, Partially Refunded, Refunded or Cancelled. Each bar shows the order value attached to it, and empty statuses are hidden.
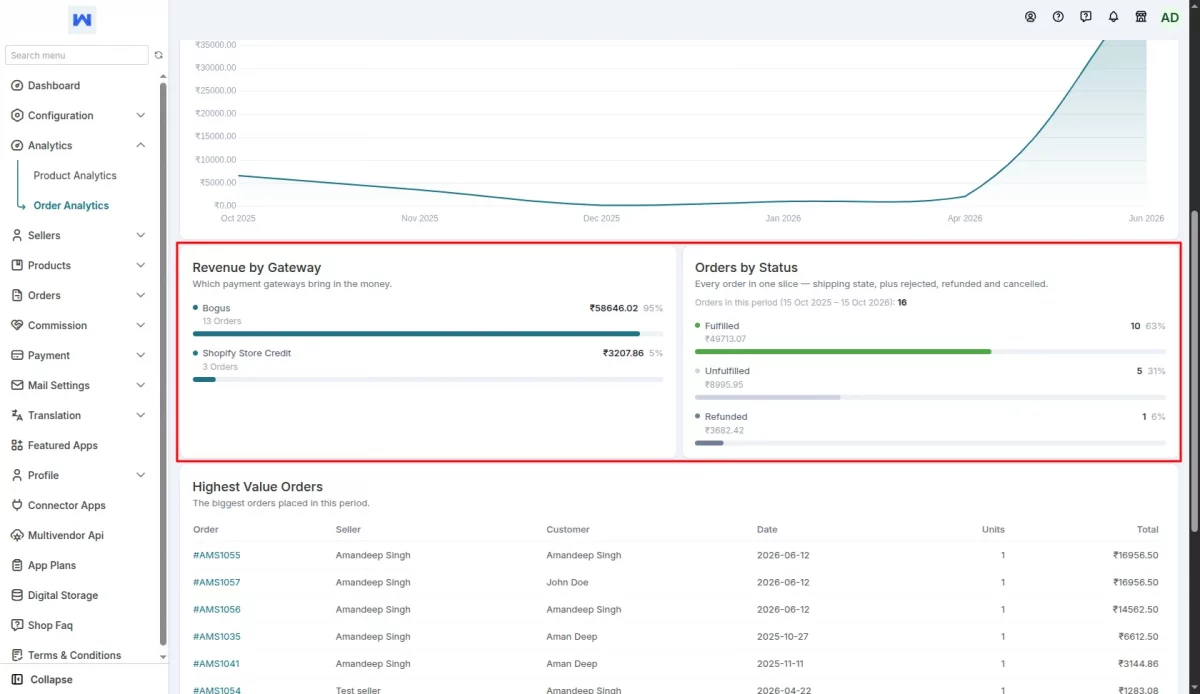
Highest Value Orders
The biggest orders of the period, with order number, customer, date, units and total. Admins also see the seller’s name. Click an order number to open the order.
Orders by Payment Status
A small table of payment statuses such as paid, pending or refunded, with the number of orders and their value.
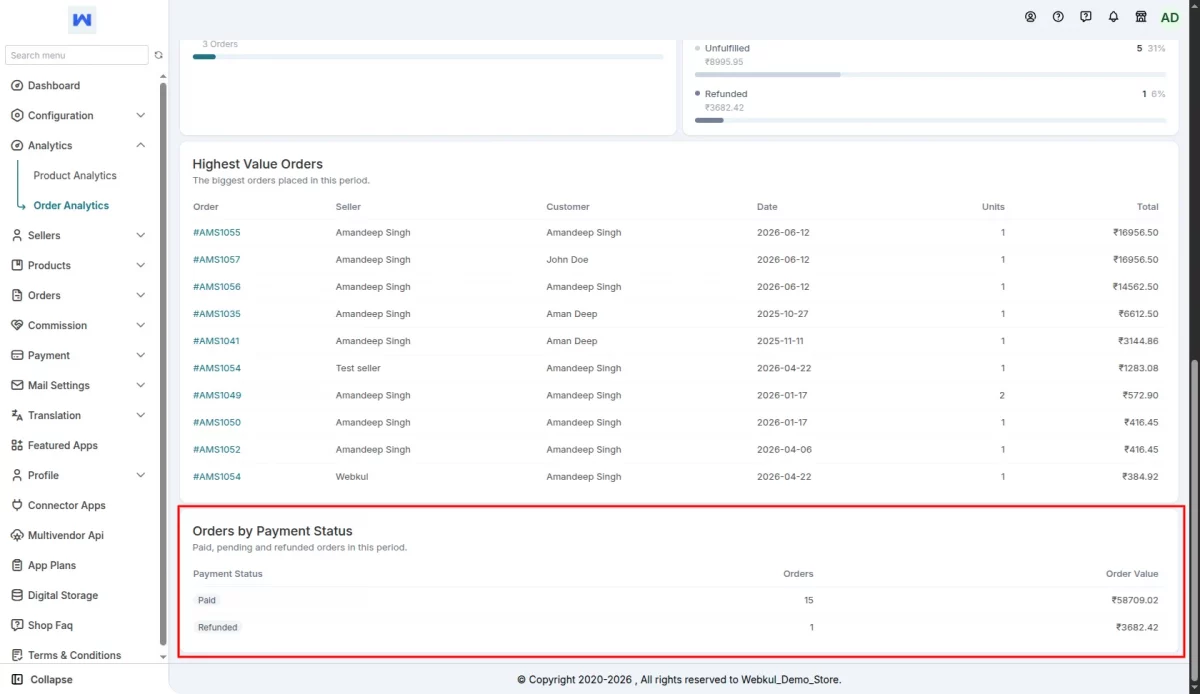
When you change the date range, every card, the Order Trend, both bar panels and both tables refresh. The change indicators compare with the same-length window right before your new range.
For example, if you pick Last 30 Days, they compare with the 30 days before that.
If a period has no orders, each panel shows “No orders in this period.”
Analytics in the Seller Portal
Sellers get the same Analytics section, with Product Analytics and Order Analytics, in the left navigation menu of their Seller Portal. Every figure is limited to the seller’s own store.
Seller End: Seller Portal >> Analytics >> Product Analytics / Order Analytics
| Area | Admin End | Seller End |
|---|---|---|
| Data shown | Marketplace-wide | Seller’s own store only |
| Seller column in Most Selling Products and Highest Value Orders | Yes | No |
| Catalogue by Seller panel | Yes | No |
| Date range filter, cards, charts and lists | Yes | Yes |
This way, sellers can track their best sellers, low-stock products, revenue and refunds on their own, without asking the admin for reports.
Why You Will Love It
- One place for the numbers: catalogue, stock, revenue, refunds and order status on two pages.
- Spot problems early: low-stock, out-of-stock and not-selling products show up before they cost you sales.
- Compare at a glance: change indicators show how each period did against the one before it.
- Sellers stay informed: each seller sees their own store’s performance in the Seller Portal.
Tip: If a count looks short, widen the date range, for example, to Last 12 Months. The missing order is probably just outside the selected window.
Need Help?
Hope you like this blog. To get more interesting blogs, keep in touch with us.
If you need any kind of support, just raise a ticket at https://we-bkul.uvdesk.com/en/. You can also contact support@webkul.com to get proper assistance.
Thank you for reading this Blog!
Don’t have a Shopify Store? Create Now!!!